Stakeholder mapping is the process of identifying stakeholders, understanding their power and interest, and deciding how to engage each one. It matters because projects involve people with different levels of influence, and treating everyone the same wastes time and misses key concerns.
This blog covers what stakeholder mapping is, why it’s important, common mapping models, the steps to build one, best practices, and a ready-to-use template teams can apply directly to their own projects.
- 1.Stakeholder mapping identifies who influences a project, how much power and interest they hold, and how best to engage them.
- 2.It helps teams prioritize relationships, improve communication, reduce risks, and increase the chances of project success.
- 3.Common models include the power-interest grid, salience model, power-predictability matrix, and stakeholder relationship mapping.
- 4.Building a stakeholder map involves identifying, analyzing, categorizing, prioritizing, and regularly reviewing stakeholders.
- 5.Best practices include identifying stakeholders early, mapping relationships (not just individuals), and updating the map as the project evolves.
What is stakeholder mapping?
Stakeholder mapping is the practice of identifying and studying the people or groups who influence an organization’s work. It gives teams clarity on who the key stakeholders are, what drives their interests, how much sway they hold, and the best way to engage each one.
Building a stakeholder map lets leaders rank relationships by importance, address concerns early, and build stronger working connections. This leads to smoother execution, better decisions, and stronger backing for the initiative.
Whether launching a product or steering change, stakeholder mapping keeps focus on the people who matter most, helping teams anticipate obstacles and align strategy with expectations.
Why is creating a stakeholder map important?
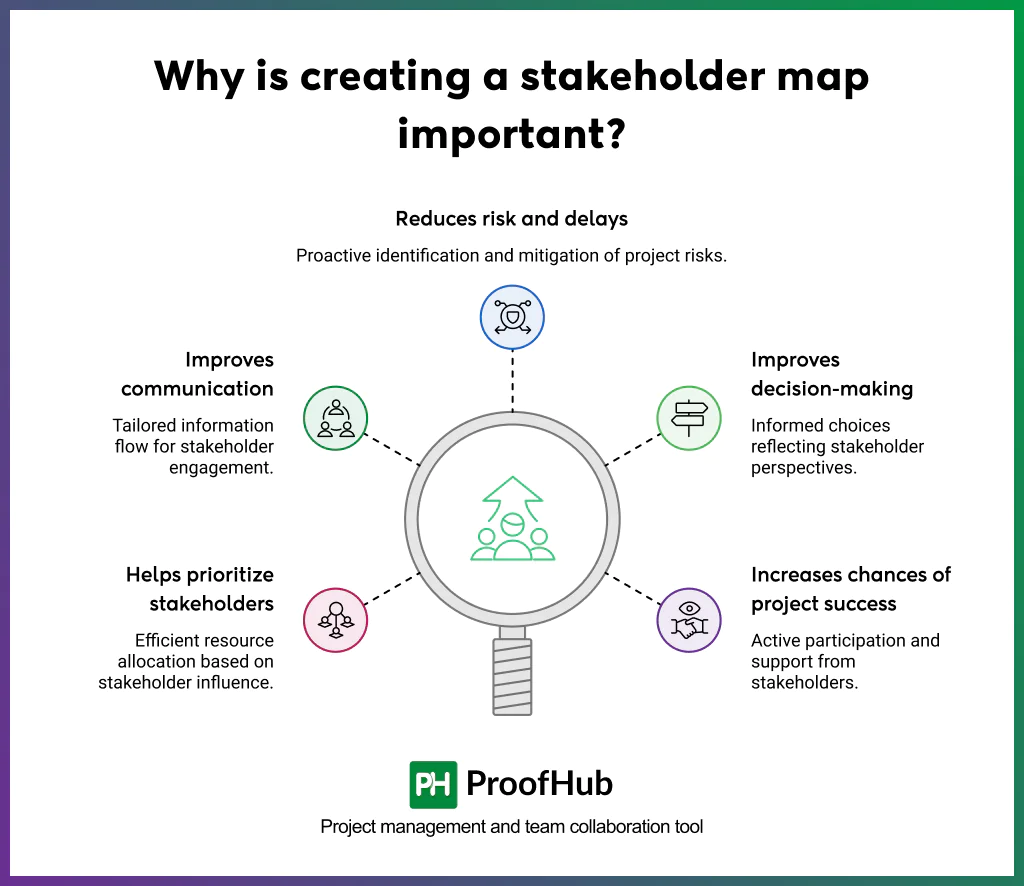
Creating a stakeholder map is important because it helps prioritize stakeholders, improves communication, reduces risks and delays, improves decision-making, and increases chances of project success.
1. Helps prioritize stakeholders: Sorts people based on their level of influence and interest in a project. Prioritization ensures limited time and resources go toward relationships that carry the most weight for project outcomes.
2. Improves communication: Clarifies who needs what information, how often, and through which channel. Tailoring communication to each stakeholder’s needs keeps everyone aligned, informed, and engaged without unnecessary noise.
3. Reduces risk and delays: By identifying influential stakeholders early, you can spot potential objections, conflicts, or blockers before they escalate. Mapping stakeholders allows proactive planning that keeps projects on schedule and minimizes avoidable setbacks.
4. Improves decision-making: Helps understand stakeholder expectations and priorities by giving project leaders context for making balanced choices. A stakeholder map ensures choices reflect a fuller picture of who is affected and how.
5. Increases chances of project success: Builds the foundation for stronger collaboration and successful outcomes by engaging stakeholders, taking timely feedback and working on it. When stakeholders feel heard and engaged, they are more likely to support the project rather than resist it.
Who needs a stakeholder map?
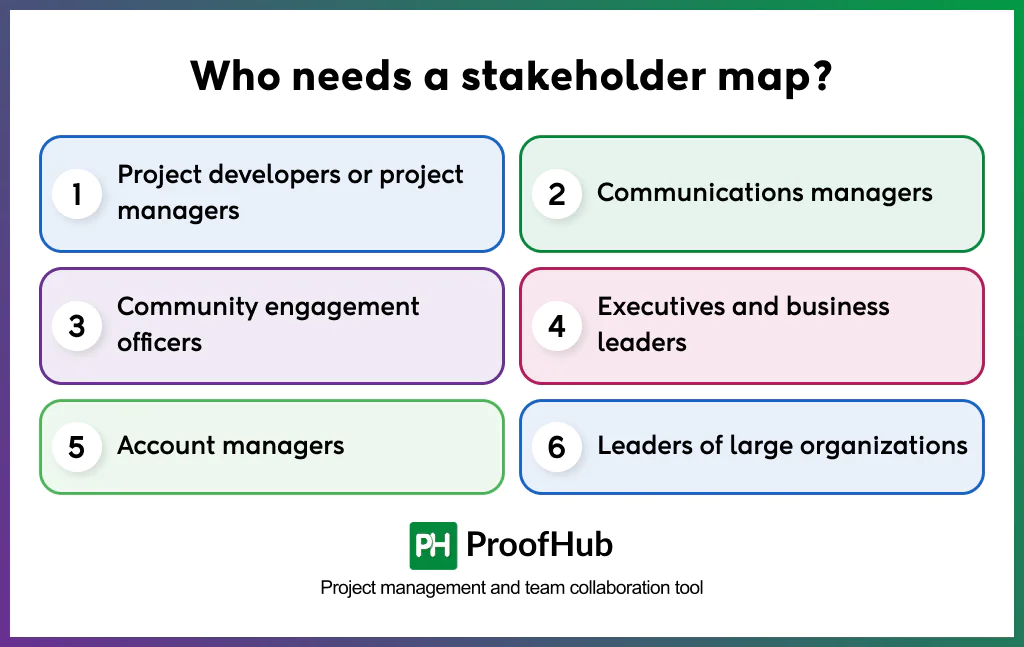
A stakeholder map is needed by project developers or project managers, communication managers, community engagement officers, executive and business leaders, account managers, and leaders of large organizations.
Each role deals with a different mix of people and priorities. A stakeholder map helps teams stay organized, focused, and prepared for the specific challenges their role involves.
1. Project developers or project managers: Uses stakeholder map to track who has authority over approvals, budgets, and timelines. It helps them manage competing expectations, plan communication, and provide support to stakeholders at every project stage.
2. Communications managers: Rely on stakeholder maps to identify who needs which message, tone, and channel. It helps them craft targeted, effective communication, as sending the same message to all the stakeholders often backfires.
3. Community engagement officers: Use stakeholder maps to understand local groups, residents, or community leaders affected by a project. This helps them build trust, address concerns early, and design engagement efforts that genuinely reflect community needs.
4. Executives and business leaders: Executives use stakeholder maps to see the bigger picture of who influences strategic outcomes, from investors to regulators. It helps leaders align strategy with stakeholder expectations, as leadership decisions carry wide impact.
5. Account managers: Uses stakeholder maps to understand client-side decision-makers and influencers within an account. This helps them nurture relationships, anticipate client needs, and reduce the risk of miscommunication or lost business.
6. Leaders of large organizations: Use stakeholder maps to manage complex networks of departments, partners, and external groups. Given the scale of such organizations, mapping helps leaders maintain clarity, coordinate efforts, and keep initiatives moving in the same direction.
What are the common stakeholder mapping models?
The six common stakeholder mapping models are salience model, stakeholder knowledge base chart, the power/ interest grid model, power-predictability matrix, stakeholder relationship mapping, and stakeholder mapping spreadsheets.
Each model offers a different lens for organizing stakeholder, be it by power, predictability, relationship, or knowledge level. Choosing the right model depends on the project’s needs and how detailed the analysis needs to be. Below are the most commonly used stakeholder mapping models.
1. Salience Model
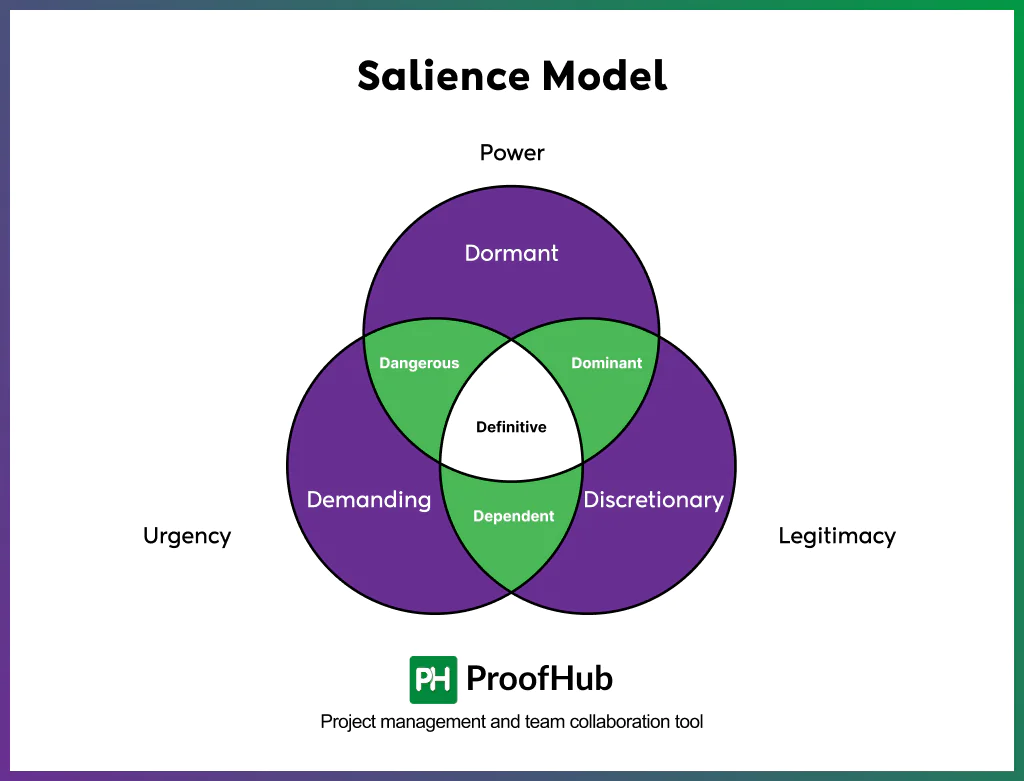
The Salience Model classifies stakeholders based on three attributes: power, legitimacy, and urgency. Depending on which of these attributes a stakeholder holds, and in what combination, they fall into one of seven distinct groups.
The salience model goes beyond simple influence and interest, helping teams understand not just who matters, but why they matter and how urgently their concerns need addressing.
The seven groups are:
- Dormant stakeholders: Hold power but lack legitimacy or urgency (Power only). The ability to influence the project exists, but with no pressing claim or urgent need, this power often stays unused unless circumstances change.
- Discretionary stakeholders: Have a legitimate claim but lack power or urgency (Legitimacy only). A valid interest in the project is present, though with no real ability to enforce action, so engagement here is often optional rather than essential.
- Demanding stakeholders: Express urgency but lack power or legitimacy (Urgency only). Quick attention or action is often pushed for, but without authority or a recognized claim, these demands can usually be acknowledged without major disruption to the project.
- Dominant stakeholders: Combine power and legitimacy (Power and legitimacy). Both the authority and the recognized right to influence the project are present, making this an important group that typically receives regular attention and formal engagement.
- Dangerous stakeholders: Combine power and urgency but lack legitimacy (Power and urgency). The claim may not be formally recognized, yet urgency paired with power can lead to coercive or disruptive actions if concerns are ignored.
- Dependent stakeholders: Hold a claim that is both legitimate and urgent but lack power (Legitimacy and urgency). Reliance on other stakeholders or authorities becomes necessary here, since independent influence over outcomes isn’t possible despite having a valid and pressing concern.
- Definitive stakeholders: Bring power, legitimacy, and urgency together (All three attributes). This is the highest-priority group in the model, as combined authority, a valid claim, and an urgent need mean concerns typically demand immediate and consistent attention.
2. Stakeholder knowledge base chart
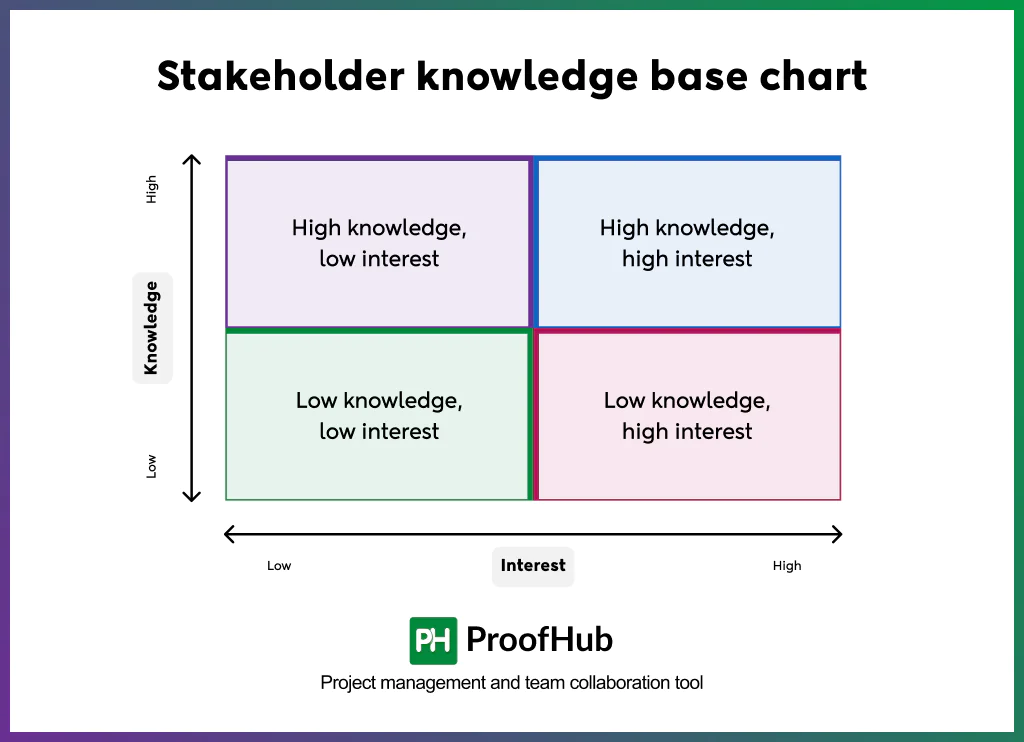
The model organizes stakeholders based on two factors: how much they know about the project and how much influence or interest they hold in it.
Plotting stakeholders this way highlights knowledge gaps early, allowing teams to focus education and communication efforts on the people who need more context to genuinely support the project.
It’s a practical model for spotting where misinformation or lack of awareness could quietly become a risk. Four quadrants make up the chart:
- High knowledge, high interest: A strong understanding of the project pairs with active investment in its outcome here. Such stakeholders usually make reliable allies and can be engaged as advocates or informed decision-makers.
- High knowledge, low interest: Good awareness of the project exists, but personal investment in its success remains limited. Periodic check-ins tend to work well for keeping this group engaged without demanding heavy involvement.
- Low knowledge, high interest: A genuine concern for the outcome comes without a clear grasp of project details. Education and consistent communication go a long way toward building informed support within this group.
- Low knowledge, low interest: Minimal awareness and minimal investment define this quadrant. Occasional updates are usually enough here, mainly to prevent misunderstandings from surfacing later on.
3. The power/ interest grid model
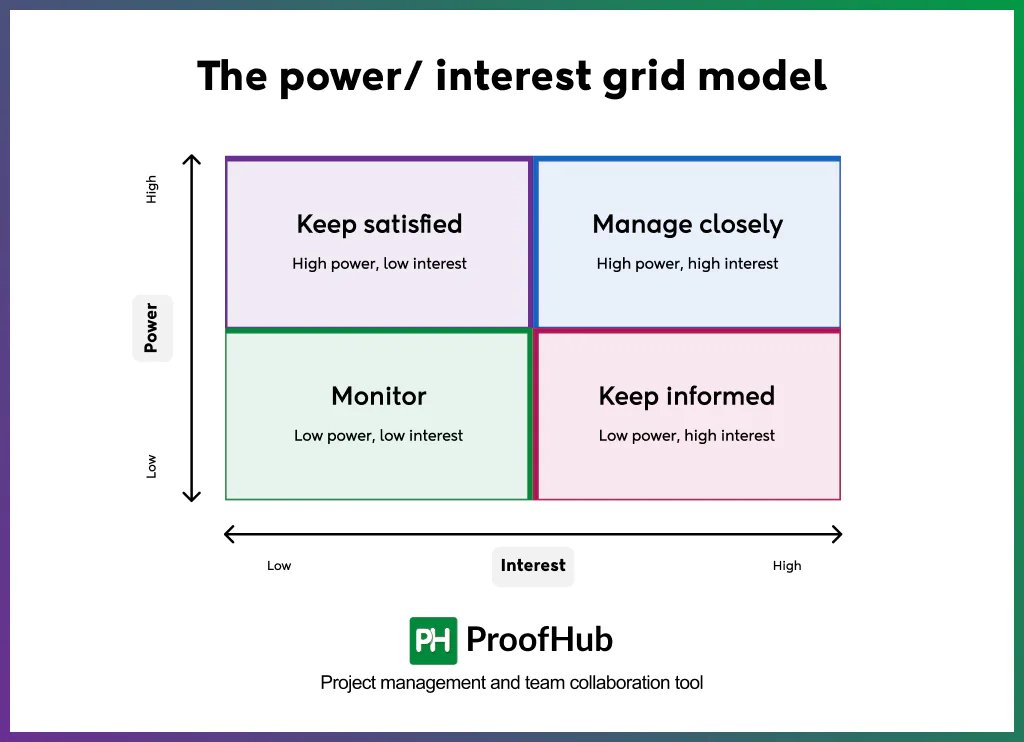
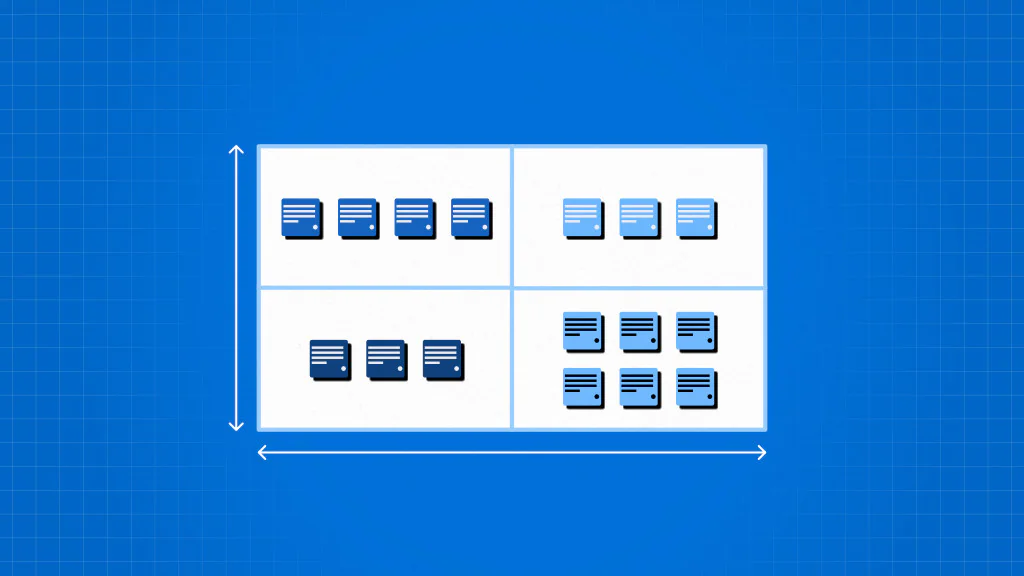
One of the most widely used stakeholder mapping models, the Power/Interest Grid plots stakeholders based on two dimensions: the level of power they hold over a project and the level of interest they have in its outcome.
Power reflects a stakeholder’s ability to influence decisions, resources, or direction, while interest reflects how invested they are in seeing the project succeed.
Placing stakeholders on this grid creates four distinct groups, each requiring a different engagement approach, making it a quick and visual way to decide where communication and effort should be prioritized.
- High power, high interest: Manage closely
Significant influence over the project combines with strong personal investment in its outcome here. Close, consistent engagement works best for this group, since their support or opposition can directly shape project success.
- High power, low interest: Keep satisfied
Considerable influence exists, but active interest in day-to-day details is limited. Enough information to keep this group content, without overwhelming them, usually prevents disengagement or unexpected pushback later.
- Low power, high interest: Keep informed
A genuine stake in the outcome comes without much authority to influence decisions. Regular updates help maintain their support and trust, even though direct involvement in decision-making stays limited.
- Low power, low interest: Monitor
Minimal influence and minimal investment define this group. Light-touch monitoring is generally sufficient, with occasional communication to keep them aware without dedicating significant resources.
4. Power-predictability matrix
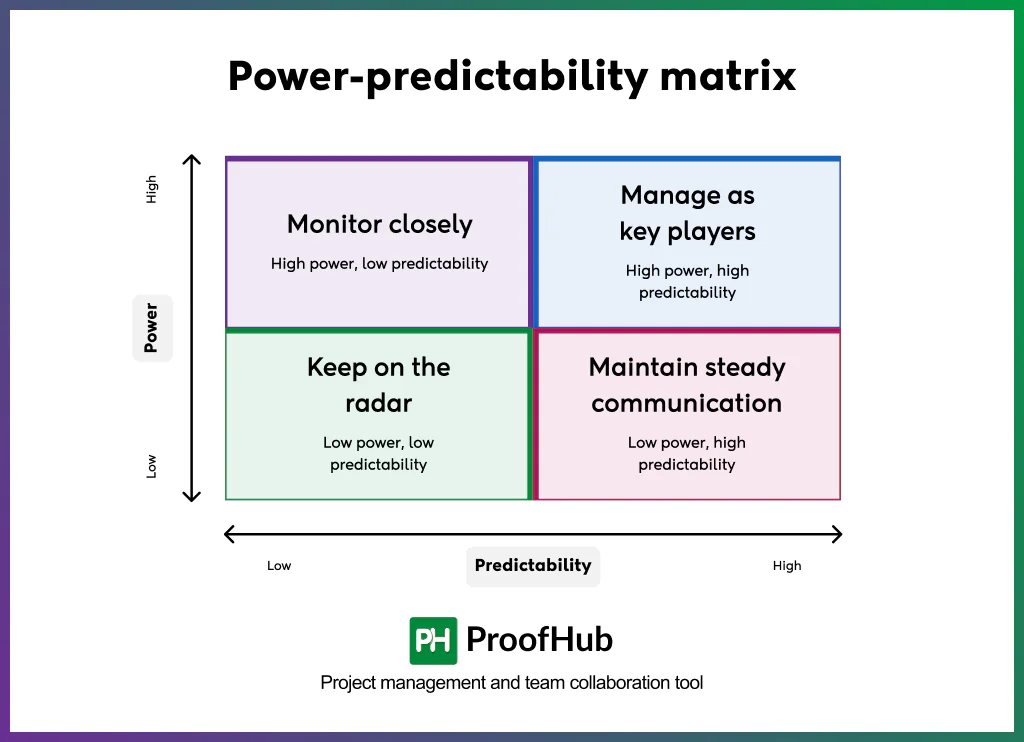
The Power-Predictability Matrix maps stakeholders based on two factors: how much power or influence they hold, and how predictable their behavior or support is likely to be throughout the project.
Unlike models that focus purely on interest or knowledge, this matrix helps teams anticipate uncertainty, flagging stakeholders who might act unexpectedly despite holding significant sway.
It proves especially useful in politically sensitive, regulatory, or high-stakes environments, where sudden shifts in stakeholder behavior can create costly surprises. The matrix breaks stakeholders into four quadrants:
- High power, high predictability: Manage as key players
Strong influence pairs with consistent, foreseeable behavior here. Stable engagement plans work well for this group, since their reactions to project developments can be reasonably anticipated in advance.
- High power, low predictability: Monitor closely
Considerable influence exists alongside unpredictable behavior or shifting positions. Close, ongoing attention becomes necessary here, as unexpected reactions from this group carry the potential to disrupt the project significantly.
- Low power, high predictability: Maintain steady communication
Limited influence comes with fairly consistent and foreseeable behavior. Routine communication tends to be enough for this group, since their stable stance rarely demands urgent or reactive attention.
- Low power, low predictability: Keep on the radar
Minimal influence combines with uncertain or inconsistent behavior in this quadrant. Occasional check-ins help keep this group visible, preventing any sudden shifts from going unnoticed even though the overall risk stays low.
5. Stakeholder relationship mapping
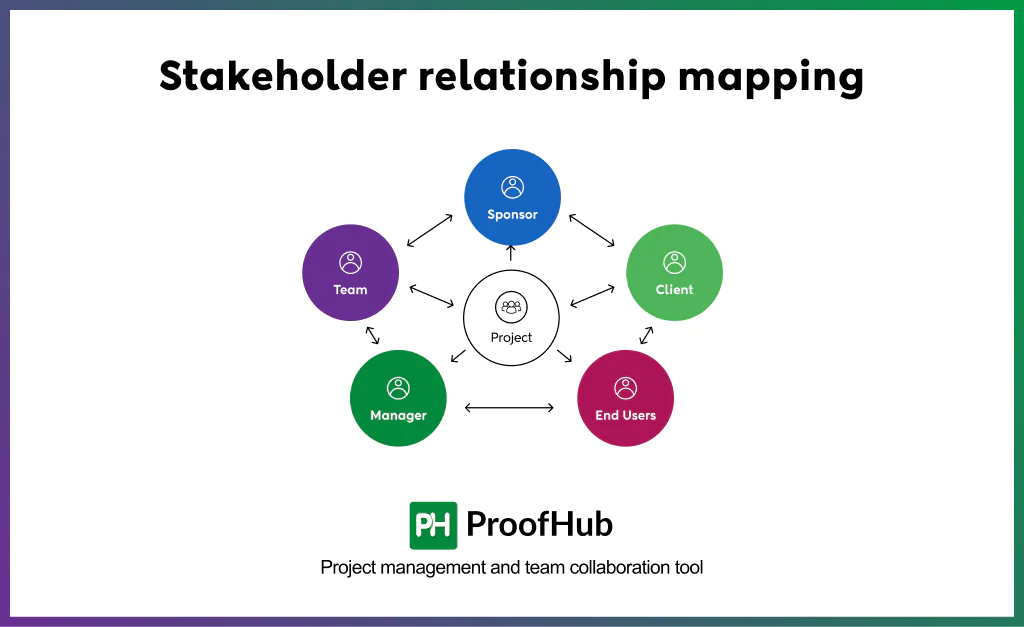
Stakeholder Relationship Mapping shifts the focus from individual stakeholders to the connections between them.
Rather than treating each person or group in isolation, this approach visually represents alliances, dependencies, and conflicts across a network of stakeholders, often using diagrams with lines or arrows to show how influence flows from one party to another.
This model matters because stakeholder decisions rarely happen independently; one stakeholder’s position can sway another’s, and hidden alliances or tensions can shape project outcomes in ways a simple list wouldn’t reveal.
It works particularly well for large or politically complex projects, where understanding how influence spreads across a network helps teams anticipate resistance, build coalitions, and address conflicts before they escalate.
6. Stakeholder mapping spreadsheets
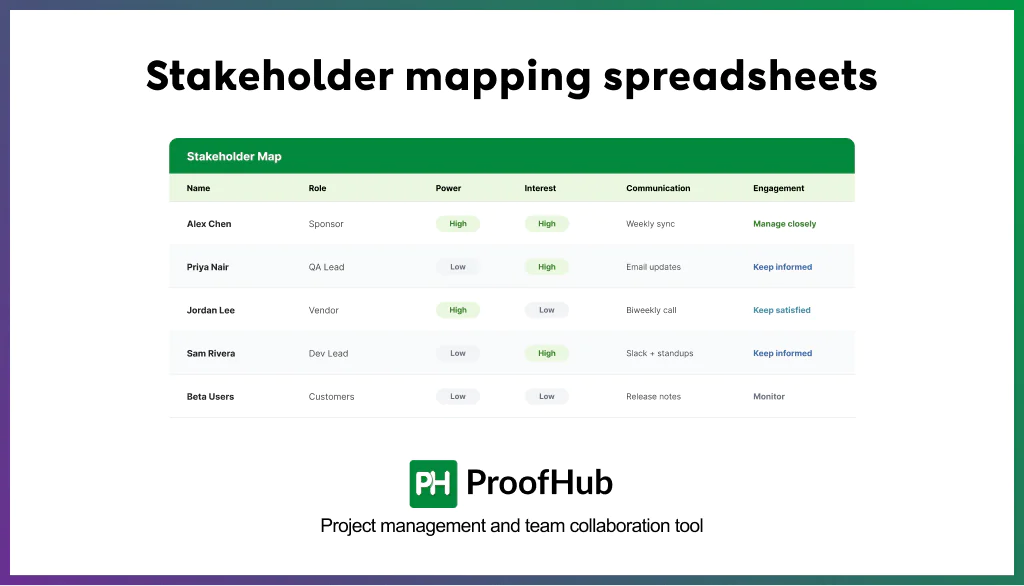
Stakeholder Mapping Spreadsheets take a more straightforward, data-driven approach to organizing stakeholder information.
Instead of a visual chart or diagram, stakeholders are listed row by row, with columns capturing details such as their level of influence, interest, contact information, communication preferences, and planned engagement actions.
This format is widely favored for its simplicity, since it’s easy to build, update, and share across teams without needing specialized design or mapping tools.
Spreadsheets work particularly well for smaller projects or teams that prefer clear, trackable data over visual models, and they also make it simple to sort, filter, or search stakeholder information as a project evolves.
What are the key steps to create a stakeholder map?
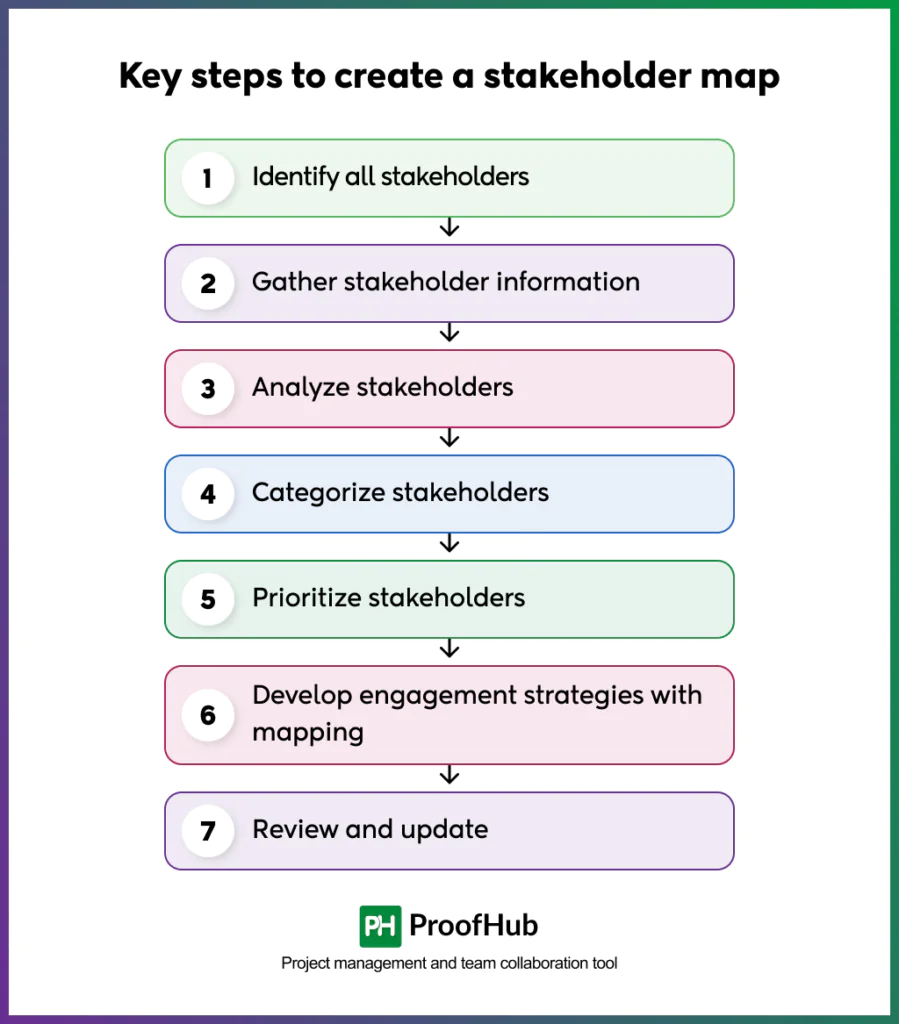
To create a stakeholder map, follow the seven steps: identify all stakeholders, gather stakeholder information, analyze stakeholders, categorize stakeholders, prioritize stakeholders, develop engagement strategies with mapping, and review and update the map regularly.
Together, these steps turn a scattered list of names into a working tool. This shows who matters most on a project, what they need, and how to keep them engaged as the project evolves.
1. Identify all stakeholders
Identifying the starting point because a stakeholder map can’t include names that were never listed.
The list should go beyond the obvious names like the sponsor and project team, and include anyone who affects or is affected by the project: end users, vendors, regulators, support teams, and even indirect influencers.
Missing a stakeholder here means they stay invisible for the rest of the project, and that’s usually when surprises show up later.
2. Gather stakeholder information
Once the list is ready, each person or group needs context: their role, their influence, what they expect from the project, and how they prefer to communicate.
This step matters because a stakeholder map is only as useful as the data behind it. Without this detail, categorization ends up based on guesswork instead of facts.
3. Analyze stakeholders
This step looks at each stakeholder’s level of interest and power over the project. It exists because not every stakeholder needs the same attention.
Analysis shows who can approve budgets, who can block a decision, and who simply wants updates. It’s the thinking step that makes the next two steps possible.
4. Categorize stakeholders
Using the analysis, stakeholders get sorted into groups, typically based on a power-interest grid: high power/high interest, high power/low interest, low power/high interest, and low power/low interest.
Categorization matters because it turns a long list into a visual structure that’s easy to act on at a glance.
5. Prioritize stakeholders
With categories in place, the next task is deciding who needs the most attention first. High-power, high-interest stakeholders usually come first since they can shape outcomes directly.
This step keeps effort proportional to influence, so equal time isn’t spent on someone who barely affects the project and someone who could make or break it.
6. Develop engagement strategies with mapping
This is where the map gets translated into action. It involves deciding how often to communicate with each group, what format works best, and what level of involvement they should have.
This step matters because it’s where the map stops being an analysis exercise and becomes a working plan, connecting each stakeholder category to a specific engagement approach.
7. Review and update
Stakeholder maps aren’t static. Roles change, new stakeholders join, and priorities shift as the project moves through its phases.
Periodic review keeps the map accurate, so engagement strategies stay relevant instead of working off outdated assumptions.
What are the best practices for effective stakeholder mapping?
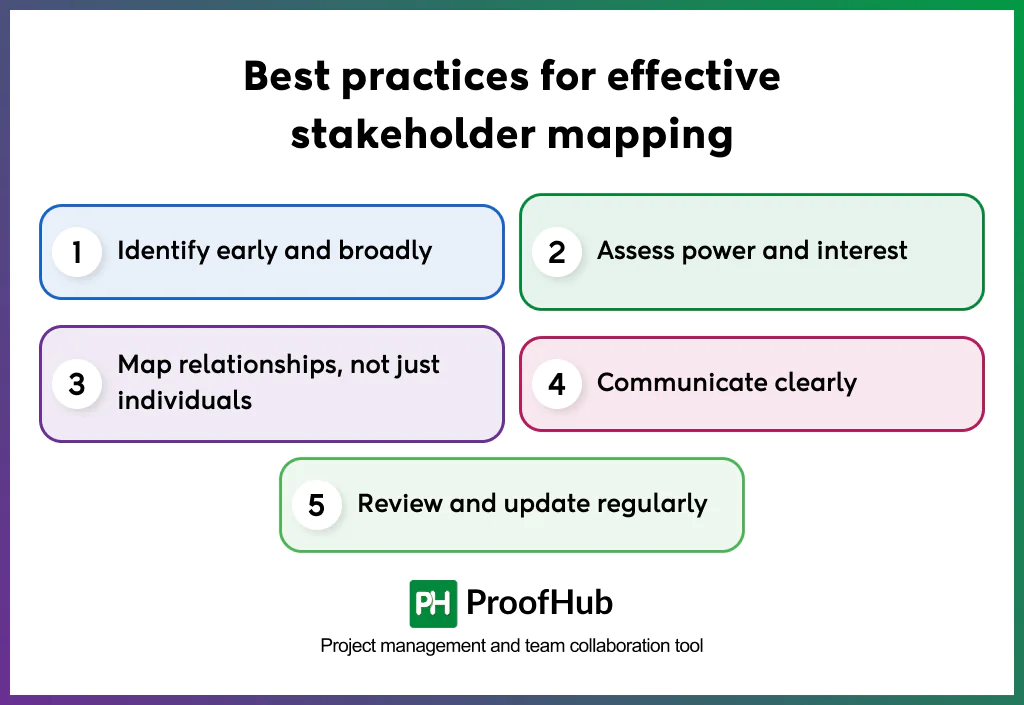
The best practices for effective stakeholder mapping are: identify early and broadly, assess power and interest, map relationships and not just individuals, communicate clearly, and review and update regularly. Following these practices keeps a stakeholder map accurate and genuinely useful, rather than a document that’s created once and quietly goes out of date.
1. Identify early and broadly: Recognize direct and indirect parties, internal teams, and external groups like vendors or regulators at project kickoff. Delay in identification leads to missed expectations and rushed engagement plans further down the line.
2. Assess power and interest: Decide how much attention and communication each stakeholder requires according to their influence and interest. It prevents wasted effort on low-impact stakeholders and ensures high-influence ones get the visibility they need to stay supportive.
3. Map relationships, not just individuals: Understand how stakeholders connect to and influence each other, not just their individual profiles. Stakeholders rarely operate in isolation, and understanding these relationships helps anticipate alliances, conflicts, or ripple effects when decisions are made.
4. Communicate clearly: Create a communication strategy according to the stakeholders’ roles, expectations, and preferred channels. Misaligned or generic updates are a common cause of disengagement, confusion, or resistance during a project’s lifecycle.
5. Review and update regularly: Revisit stakeholder maps at key project milestones or whenever roles and priorities shift. Stakeholder influence and interest are rarely fixed, and an outdated map can lead to misdirected engagement efforts.
Stakeholder mapping example
Let’s take a stakeholder mapping example of a software product launch at an IT company
A mid-sized IT company launching a new SaaS product maps its stakeholders using a power-interest grid. The CTO and product sponsor fall into the high power, high interest quadrant, since they approve budgets and expect regular updates.
The QA lead and development team sit in the low power, high interest quadrant, staying closely involved but with limited decision authority.
External vendors supplying third-party integrations fall into high power, low interest, requiring occasional but timely coordination.
Beta customers land in low power, low interest, needing light-touch communication like release notes. This mapping helps the project manager prioritize weekly syncs with leadership, biweekly check-ins with vendors, and simple email updates for beta users.
Stakeholder mapping template
A stakeholder map is only useful if it’s easy to build and just as easy to update. Use the template below to identify stakeholders, rate their power and interest, and assign the right engagement strategy without starting from a blank sheet. It comes pre-built with dropdowns, auto-calculated categories, and color-coded status tracking, so most of the setup work is already done.
Stakeholder mapping template
Download the free stakeholder mapping template and start mapping your project stakeholders in minutes.
Download the free template nowHow often should a stakeholder map be reviewed?
A stakeholder map should be reviewed at every major project milestone, whenever the project scope changes, or whenever new stakeholders join or leave. For longer projects, a monthly or quarterly check-in works well to keep the map current instead of letting it drift out of sync with reality.
What is the difference between stakeholder mapping and stakeholder analysis?
Stakeholder analysis is the process of studying each stakeholder’s power, interest, and influence over the project. Stakeholder mapping is the visual output of that analysis, plotting stakeholders into a grid or chart. In short, analysis is the research, and mapping is how that research gets organized and presented.
What information should a stakeholder map include?
A stakeholder map should include each stakeholder’s name or group, role, level of power and interest, expectations from the project, preferred communication method, and their category or quadrant on the grid. This combination gives a complete picture of who needs what kind of engagement.
What is the most common stakeholder mapping technique?
The power-interest grid is the most widely used stakeholder mapping technique. It plots stakeholders across two axes, power and interest, sorting them into four quadrants that guide how much attention and communication each group should receive.
Conclusion
Stakeholder mapping isn’t just a planning exercise; it’s what keeps a project grounded in the people who can make or break it. From identifying stakeholders early to categorizing them by power and interest, each step builds toward one goal: knowing who to engage, how, and when.
As projects evolve, so do stakeholders, which is why regular reviews matter as much as the initial mapping. With a structured approach and the right template, teams can turn stakeholder management from guesswork into a repeatable, reliable process that supports better decisions and smoother project delivery.