
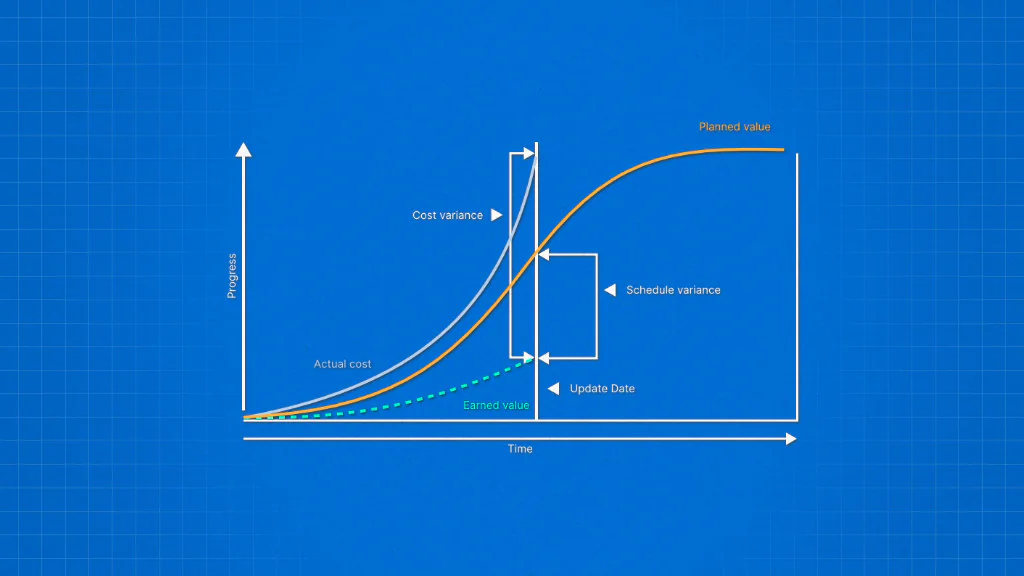
A project can look on track while the real work falls behind. Spending matches the budget, and time matches the schedule, yet neither number shows how much work the team actually completed. A team can spend half its budget while finishing far less than half the work, and standard tracking rarely flags it.
Earned value management closes that gap. The technique ties spending and schedule to completed work, giving project managers one measurable answer to whether a project is actually on track.
The article covers what EVM is, its components, and its core formulas. Step-by-step sections walk through calculating and implementing EVM, and explain how to read EVM metrics to measure real performance. The article closes with the best EVM tools, a full worked example, and answers to common EVM questions.
- 1.Earned value management tracks the real work completed, alongside money spent and time passed.
- 2.Three values: planned value, earned value, and actual cost together reveal a project’s true status.
- 3.Cost variance and schedule variance reveal whether a project is over budget or behind schedule.
- 4.Earned value management forecasts the project’s final cost well before the project finishes.
- 5.Tracking these numbers regularly lets project managers catch problems while they’re still small and easy to fix.
What is earned value management?
Earned value management (EVM) is a project management technique. It brings together three critical dimensions: scope, schedule, and cost into a single framework. The framework evaluates how a project is actually performing against its plan.
EVM measures project performance by comparing three values: planned value, earned value, and actual cost. EV represents the scope accomplished, PV represents the schedule baseline, and AC represents the cost. These three values show if the project is over or under budget and ahead or behind schedule. The comparison rests on real work done, not just time or money spent.
What are the benefits of earned value management (EVM)?
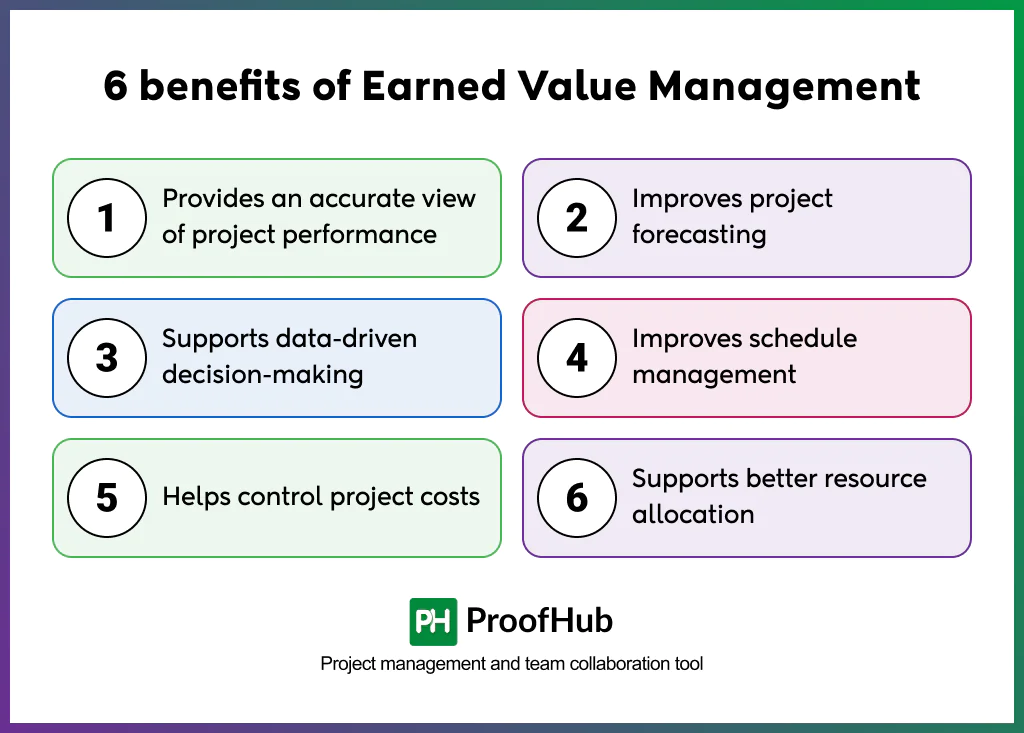
The key benefits of Earned value management are that it provides an accurate view of project performance, improves project forecasting, supports data-driven decision-making, improves schedule management, helps control project costs, and supports better resource allocation.
Together, these benefits give project managers a reliable way to spot problems early and act before they grow.
Each benefit is explained below.
1. Provides an accurate view of project performance: Combines cost and schedule data into one measure and provides a single number you can trust at any point in the project.
2. Improves project forecasting: Uses current performance trends to predict final cost and completion date, rather than relying on guesswork. It provides accurate project direction and early warning instead of at the end-of-project.
3. Supports data-driven decision-making: Gives concrete numbers to justify budget changes, scope adjustments, or corrective action. A specific variance or index drives each decision rather than the team’s opinion.
4. Improves schedule management: Flags schedule slippage early by comparing work completed to work planned. EVM compares planned and completed work continuously, catching that slippage while there’s still time to react.
5. Helps control project costs: Highlights cost overruns specifically, isolating the cost dimension from the schedule dimension. Cost variance shows the currency difference between value earned and money spent, and the cost performance index shows how efficiently the team spends. It helps adjust scope, staffing, or spending before a small overrun turns into a major one.
6. Supports better resource allocation: Shows which pieces of work are behind or over budget, so managers redirect resources where they’re needed most. It helps move people, budget, or time to the areas affecting performance the most.
What are the core components of earned value management (EVM)?
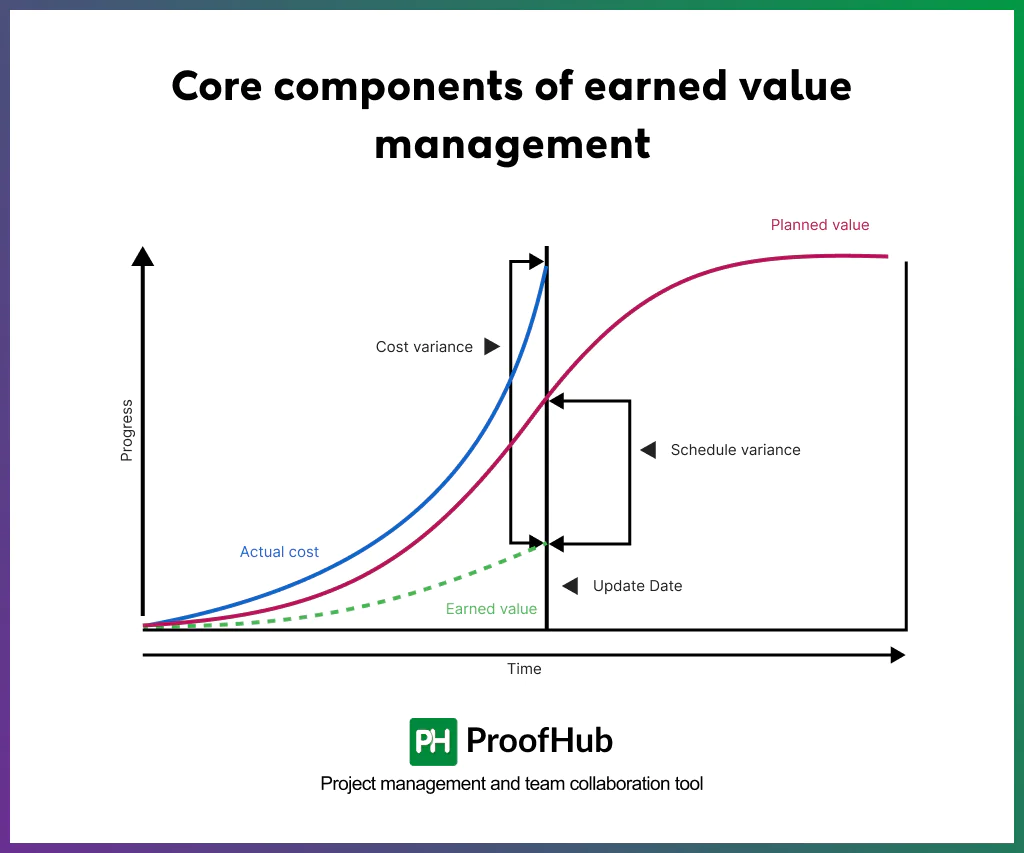
Three core metrics build EVM: planned value, earned value, and actual cost.
Together, they show whether a project is ahead, behind, on budget, or over budget.
Each metric looks at the project from a different angle: what was planned, what got done, and what it cost to do it.
Compared side by side, they pinpoint exactly where a project stands at any given moment.
1. Planned value (PV) or budgeted cost for work scheduled (BCWS)
PV is the authorized budgeted cost of the work the team scheduled to complete by a specific point in time.
Formula: PV = (Planned % of work) × (Total project budget) (BAC)
Example: A $100,000 project plans to have 30% of the work done by the end of month 2. PV = 30% × $100,000 = $30,000.
2. Earned value (EV) or budgeted cost of work performed (BCWP)
EV is the budgeted cost of the work actually completed on a project up to a specific date. It measures real progress, not effort or time spent. For multi-deliverable projects, calculate this for each deliverable and add the results.
Formula: EV = (Actual % of work completed) × (Total project budget) (BAC)
Example: If a $100,000 project is 25% finished, the EV is 25% of $ 100,000 = $25,000.
3. Actual cost (AC), or actual cost of work performed (ACWP)
AC is the real money spent to complete the work done so far, regardless of what was planned.
Formula: AC = Actual money spent on work completed so far (recorded directly from cost/accounting data, not calculated)
Example: If the team spent $28,000 to complete 25% of the work, AC = $28,000.
Relationship between PV, EV, and AC
Planned value (PV), earned value (EV), and actual cost (AC) only make sense when project managers compare them together, not when they look at each one alone.
- PV shows the value of work planned by a certain date.
- EV shows the value of work actually completed by that date.
- AC shows the actual money spent to complete that work.
Comparing EV to PV shows if the project is ahead or behind schedule. Comparing EV to AC shows if the project is over or under budget. Each comparison answers a different question, so project managers don’t have to guess which one is the problem.
Looking at the schedule and cost comparisons together shows the true status of the project. It could be on time and on budget, ahead but overspending, or behind but under budget. Project managers get this full picture in seconds, without waiting on status updates from the team.
Example: A project plans to complete $30,000 worth of work by the end of month 2 (PV = $30,000). By that point, the team has actually completed only $25,000 worth of work (EV = $25,000), and has spent $28,000 to get there (AC = $28,000).
Compare EV to PV first.
The team completed $25,000 worth of work when the plan called for $30,000 worth. Since less work got done than was planned by this point, the project is behind schedule.
Compare EV to AC next.
The team spent $28,000 to produce work that’s only worth $25,000. Since more money went out than the completed work is actually worth, the project is over budget.
Earned value management formulas
Steps to calculate earned value in project management
The four steps to calculate earned value in project management are: establishing a performance baseline, determining the completion percentage, calculating earned value, and comparing earned value against planned and actual plans.
Earned value management tracks project performance through three values: planned value (PV), earned value (EV), and actual cost (AC), the money spent to complete the work.
Calculating these values at regular intervals shows whether a project is on schedule and on budget.
The four steps below walk through the full process, from setting the baseline to reading the results.
Step 1: Establish performance baseline
Define the scope, budget, and schedule before work starts. Break the project into deliverables, assign a budget to each one, and map each to the timeline. Lock the baseline and change it only through approved change control.
Example: A marketing campaign has a $40,000 budget over three months. The team allocates $10,000 to research and strategy in Month 1, $15,000 to content creation in Month 2, and $15,000 to distribution and optimization in Month 3.
Step 2: Determine the completion percentage
Select one objective way to measure completion for each deliverable, and use one method per deliverable. Pick the method that fits the type of work:
- 0/100 method: Count the work as 0% until it’s finished, then 100%. It suits short tasks.
- 50/50 method: Count 50% when the task starts and the remaining 50% when it finishes.
- Weighted milestones: Give each milestone a share of the deliverable’s budget and count it when the milestone is done.
- Unit counting: Track finished units against total units, such as 40 of 80 pages built.
Example: The team uses unit counting. At the end of Month 2, audience research is fully delivered, so it is 100% complete. Six of the ten planned ad creatives are finished, so creative production is 60% complete.
Step 3: Calculate earned value
Multiply each deliverable’s completion percentage by its budget, then add the results. The total is earned value. Recalculate it every week or month so the figure stays current.
Example:
- Audience research: 100% × $8,000 = $8,000
- Creative production: 60% × $20,000 = $12,000
- EV = $20,000
Step 4: Compare earned value against planned and actual plans
Add the budgets of all work due by this date to get planned value. Take actual cost from the project’s expense records. Compare the earned value with PV to see schedule status, and earned value with actual cost to see cost status.
Example: The baseline scheduled audience research and creative production to finish by the end of Month 2, so planned value= $8000+ $20,000= $28,000.
Expense records show $24,000 spent, so the actual value is $24,000.
Earned value= $20,000 is lower than planned value, which means the campaign is behind schedule.
Earned value= $20,000 is lower than the actual cost, which is $24,ooo, so the project is over budget.
How to implement earned value management for better project performance?
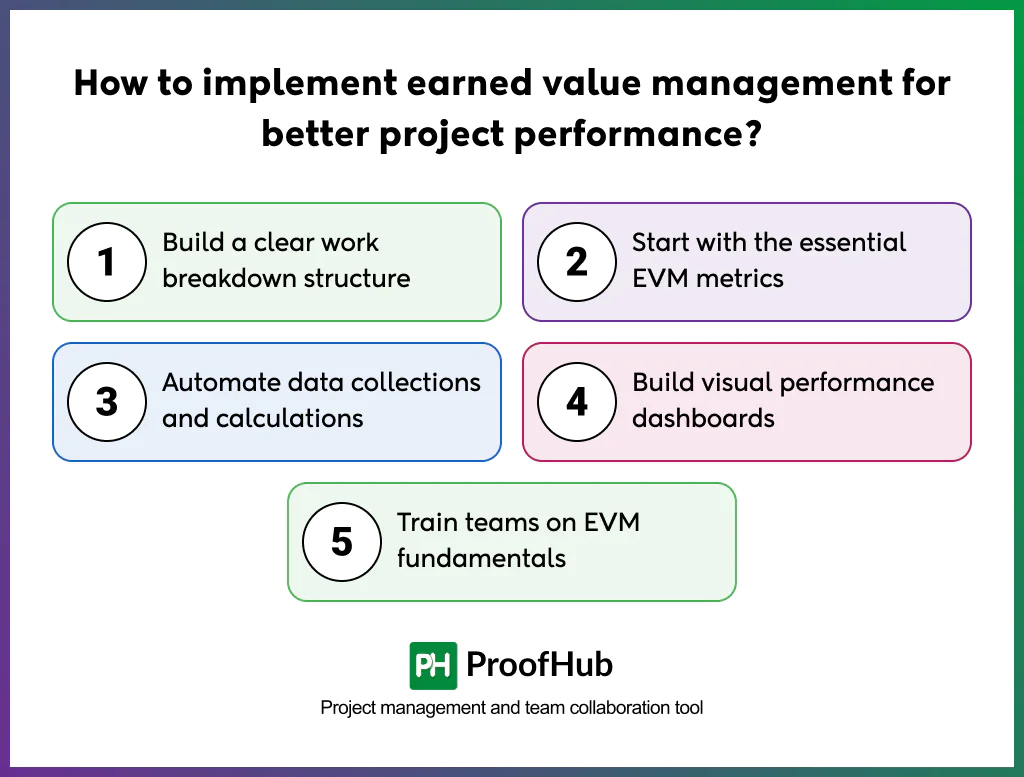
To implement EVM for better project performance, project managers need to build a clear work breakdown structure, record essential EVM metrics, automate data collection and calculation, build visual performance dashboards, and train the team on EVM fundamentals.
Implementing EVM refers to building a system that tracks planned work, completed work, and actual spending at every reporting date.
The system delivers accurate numbers only when the team defines scope clearly, measures progress objectively, and records costs on time.
Follow the six actions below to set up EVM correctly, from breaking down the work to training the team that reports it.
1. Build a clear work breakdown structure
Split the project into small, specific deliverables. A work breakdown structure (WBS) is the list that shows every piece of work in the project.
Assign each piece an owner and a budget, so every dollar and every task has a place in the plan.
For instance: the product launch campaign splits into audience research, creative production, ad launch, and reporting. Each item gets an owner and its own budget.
2. Start with the essential EVM metrics
Begin by recording planned value, the budgeted value of the work scheduled by the reporting date.
Next, record earned value, the budgeted value of the work actually completed by that date, followed by actual cost, the money spent to complete that work.
Then subtract AC from EV to get cost variance (CV), which shows whether the project is over or under budget.
Finally, subtract PV from EV to get schedule variance (SV), which shows whether the project is ahead of or behind schedule.
Add forecasting metrics such as estimation at completion only after the team reads these five with confidence.
3. Automate data collections and calculations
Use a project management tool like ProofHub to capture progress and cost inputs in one place.
Track task completion on Kanban boards and Gantt charts, and log hours through timesheets, so progress and effort data update as the work happens.
Pull these figures into a report at each reporting date and run the EVM formulas on them.
Automation reduces manual entry errors and frees the team from chasing status updates.
4. Build visual performance dashboards
Turn the EVM numbers into a simple chart that shows the project’s status at a glance. Draw three lines on one graph: the work you planned (PV), the work you completed (EV), and the money you spent (AC).
Time runs along the bottom, and money rises up the side. Compare the lines to read the status.
If the completed-work line (EV) falls below the planned-work line (PV), the project is behind schedule.
If the spending line (AC) rises above the completed-work line (EV), the project is over budget.
Update the chart at every reporting date so it always shows current status.
5. Train teams on EVM fundamentals
Teach the team who reports progress or cost how their inputs feed the calculations.
Cover the basics: what PV, EV, and AC mean, and why honest percentages matter.
Teams that understand the link between their updates and the results report more accurately.
How is performance measured with earned value management?
EVM starts with four inputs: Planned Value (PV), Earned Value (EV), Actual Cost (AC), and Budget at Completion (BAC). These inputs are combined into metrics that measure current performance and forecast the finish. The metrics expose deviations early, so decisions rest on numbers instead of impressions.
Variance analysis
Variances measure the gap between two values in currency units. A positive value signals good news, and a negative value signals a problem.
- Cost variance (CV): EV − AC. A positive CV means the project is under budget. A negative CV means it is over budget.
- Schedule variance (SV): EV − PV. A positive SV means the project is ahead of schedule. A negative SV means it is behind schedule.
Performance indices
Indices measure efficiency as a ratio. A value above 1.0 beats the plan, and a value below 1.0 falls short.
- Cost performance index (CPI): EV ÷ AC. CPI shows how much value the project earns for every unit of currency spent.
- Schedule performance index (SPI): EV ÷ PV. SPI shows how fast the project progresses compared to the plan.
Forecasting metrics
Forecasts predict the finish, assuming current cost efficiency continues.
- Estimate at completion (EAC): BAC ÷ CPI. EAC forecasts the total cost of the project at completion.
- Estimate to complete (ETC): EAC − AC. ETC forecasts the additional cost needed to finish the remaining work.
Additional key indicators
- Variance at completion (VAC): BAC − EAC. A negative VAC forecasts an overrun, and a positive VAC forecasts savings.
- To-complete performance index (TCPI): (BAC − EV) ÷ (BAC − AC). TCPI shows the cost efficiency the team must achieve on the remaining work to finish within budget.
Best Earned Value Management (EVM) tools
The right EVM tool depends on project size, industry, and reporting requirements. The four tools below range from enterprise scheduling platforms to dedicated EVM engines. Enterprise tools manage complex, multi-project programs, while dedicated tools focus on detailed cost and performance reporting.
Before choosing, check whether contracts require formal EVM reporting and whether the tool connects with your scheduling and accounting systems.
1. Oracle Primavera P6: Oracle Primavera P6 is an enterprise project scheduling and portfolio management tool. It links cost, resources, and schedules across large programs, and its earned value reporting suits construction, energy, and infrastructure projects with complex dependencies.
2. Deltek Cobra: Deltek Cobra is a dedicated cost management and earned value tool. The tool integrates with scheduling software, calculates EVM metrics automatically, and supports formal reporting standards, which makes it a common choice for government contractors and regulated industries.
3. Encore Analytics – Empower: Empower is an EVM analytics platform built for performance reporting. It consolidates cost and schedule data, runs variance analysis, and produces forecasts, helping teams that need detailed EVM reporting and analysis instead of general project management features.
4. Microsoft Project: Microsoft Project is a widely used scheduling tool with built-in earned value fields. The tool calculates PV, EV, and AC from baselines and progress updates, which suits teams that want basic EVM tracking without a specialized tool.
Example of earned value management
A marketing agency runs a product marketing launch campaign with a $48,000 budget (Budget at Completion, BAC) over four months. At the end of Month 2, the project manager runs an EVM check.
- Planned value (PV): The plan scheduled audience research ($8000) and creative production ($20,000) to finish by now. So PV = $28,000.
- Earned value: Audience research is 100% done, and creative production is 60% done. EV = $8000+ (60% × $20,000) + $20,000.
- Actual Cost (AC): Expense records show $24,000 spent.
What are common EVM mistakes to avoid?
Common EVM mistakes include using subjective completion percentages, skipping baseline updates after approved scope changes, and reviewing EVM data too late to act. Teams also make the mistake of tracking only the total project, which hides where problems start. Track each piece of work separately, define “done” in advance, and review the numbers at every reporting date.
At what stage of a project should earned value management be implemented?
EVM is implemented during project planning, before work begins. EVM needs an approved baseline of scope, schedule, and budget to measure against, and that baseline exists only after planning. Adding EVM mid-project is possible, but early performance data will be missing, so the numbers show less accurate trends and forecasts.
Who is responsible for calculating earned value management?
The project manager usually calculates EVM, often with support from the project management office (PMO) or a project control team. Team members supply progress and cost data. On large or regulated projects, a cost analyst or EVM specialist may own the calculations, especially when contracts require formal EVM reporting.
Can earned value management work with agile methodologies?
Yes, with some adaptation. Agile teams calculate Earned Value using completed story points or delivered features instead of percent-complete estimates. Many organizations apply EVM at the release or program level while teams manage sprints, which combines agile flexibility with EVM’s cost and schedule visibility.
Conclusion
Earned value management gives project managers a repeatable way to check status: set the baseline, track PV, EV, and AC at every reporting date, and calculate the variances and indices covered above. The numbers only help if someone acts on them. A negative cost variance calls for a scope or staffing adjustment. A falling schedule performance index calls for a schedule review. Waiting until the next milestone to check in defeats the purpose of tracking in real time. Start small if EVM is new to your team: track PV, EV, and AC on one project, build the habit of reviewing them together, then expand from there.