
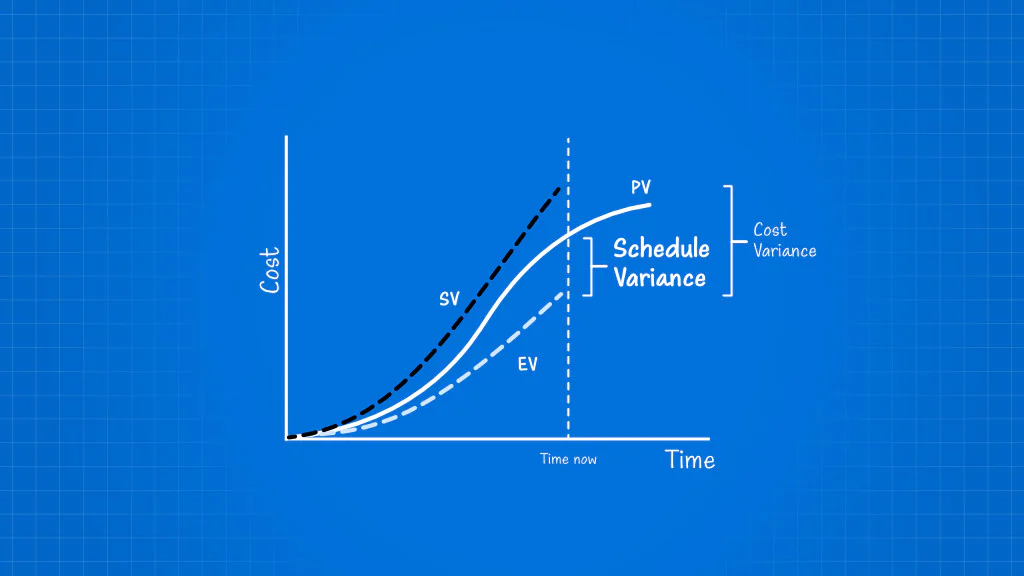
Every project manager eventually faces the same question: is the project actually on schedule, or does it just feel that way? Status meetings and gut checks can only go so far. What’s needed is a number that tells the real story. That’s where schedule variance comes in.
As a core metric within earned value management (EVM), schedule variance turns project progress into a concrete, measurable figure by comparing what’s actually been accomplished against what was planned. Instead of relying on subjective updates, project managers get a clear signal of whether work is ahead, behind, or right on track.
This guide breaks down what schedule variance is, how to calculate it using the SV formula, how to interpret positive and negative results, and how to use it to keep projects running on time.
- 1.Schedule variance (SV) measures the difference between earned value (EV) and planned value (PV), expressed in monetary units.
- 2.SV can be tracked as a point-in-time metric for real-time updates or as a cumulative metric for overall project evaluation.
- 3.A positive SV means the project is ahead of schedule, a negative SV means it’s behind, and a zero SV means it’s exactly on track.
- 4.SV is calculated using BCWP (earned value) and BCWS (planned value), with the formula SV = BCWP − BCWS.
- 5.Improving SV requires regular reassessment of PV and EV, prioritizing critical path tasks, and reallocating resources to delayed work.
- 6.SV supports early delay detection, data-driven decisions, and clearer stakeholder reporting.
- 7.SV has key limitations, including no visibility into the critical path and no ability to represent actual time delays.
- 8.SV works best when paired with other EVM metrics like SPI, since it can’t capture the full picture on its own.
What is schedule variance?
Schedule variance (SV) is the measure of deviation from the schedule baseline, as calculated in terms of the difference between earned value (EV) and planned value (PV). It is expressed in monetary units (Dollars, Pounds etc.)
Schedule variance provides a useful metric for project managers to monitor a project as it is being executed. Depending on the status of the project, the value of the variance can be positive, negative, or zero. Positive variance means that the project is progressing ahead of schedule, while negative variance means that the project is lagging. Zero variance means that the project is just on track.
What are the ways to measure schedule variance over time?
Schedule variance can be measured in two ways: point-in-time SV and cumulative SV. Point-in-time SV is calculated at a single moment, giving a snapshot of how the project stands right then. Cumulative SV, on the other hand, is tracked as a running total across the life of the project.
Each method serves a different purpose; together, they give project teams both a short-term and long-term view of schedule health.
Here’s how each one works:
- Point-in-time/Period-by-period SV: In this method, SV is calculated at each point of time in the project. It could be every day, every two days, or even a week. This method gives constant updates about how far behind or ahead of schedule a project is. This method is used to make decisions in real time.
- Cumulative SV: In this method, SV is calculated as a running total over the entire project, or at the end of several consecutive work periods. This method is used when the scheduled performance of the entire project is to be evaluated.
| Insight: What is project variance? Project variance is a wider term that encompasses schedule variance and other useful metrics that are used in Earned Value Management. Other metrics commonly used under project variance are: Cost Variance (CV): CV is the measure of how over or under the planned budget a project is. It is the difference between Earned Value (EV) and Actual Cost (AC). CV is often used together with Cost Performance Index (CPI), which is the ratio of Earned Value to Actual Cost. Scope Variance: Scope variance measures the divergence from the pre-planned tasks needed to complete a project successfully that were part of the project scope. If new tasks are added to the project that were not required before (also called scope creep), it contributes to scope variance. |
How to calculate schedule variance?
Measuring schedule variance relies on two fundamental metrics within earned value management: The BCWS and BCWP; they are then used in the SV formula. These metrics translate raw project progress into standardized monetary values for easy comparison. By tracking what was planned against what was actually achieved, project managers remove subjectivity from timeline assessments.
To compute the final variance, you must first understand these two underlying metrics:
BCWS (Budgeted Cost of Work Scheduled)
Also known as Planned Value (PV), it is the part of performance measurement baseline that stipulates the amount of value generated by the successful completion of a task. BCWS, along with other metrics, forms part of the Performance Measurement Baseline.
| For example, if a certain project is scheduled to take 250 man-hours to complete and each man-hour costs $8, then the total scheduled budget for completion of the project is 250 x $8 = $2000. |
BCWP (Budgeted Cost of Work Performed)
BCWP aka Earned Value (EV), it is defined as the proportion of the BCWS the task has earned back. Together with BCWS, it constitutes core metrics for the evaluation of Schedule Variance and Schedule Performance Index (SPI).
| For example, if the project is 50% complete till date, and the BCWS was scheduled to be $2000, then the total current BCWP amounts to 50% x $2000 = $1000. |
Schedule variance formula
SV is calculated by subtracting BCWS (PV) from BCWP (EV). The formula becomes:
SV = BCWP – BCWS
OR
SV = EV – PV
| Using our earlier example, since the task is only 50% complete, the schedule variance is calculated by subtracting planned value from the earned value:SV = $1000 – $2000 = -$1000 |
Notice that the SV is a negative value, signifying that the task is behind schedule.
How to interpret the schedule variance results?
Schedule variance results generally fall into three categories: zero, positive, and negative. A zero SV means the project is running exactly according to plan. A positive SV indicates the project is ahead of schedule, while a negative SV signals it is falling behind.
Understanding which category a project falls into is the first step toward deciding what action, if any, needs to be taken. Here’s what each result means in practice:
- If SV is zero: SV equal to zero means earned value matches planned value exactly, confirming the project is precisely on schedule. This is the ideal state and requires no corrective action. It occurs when task completion rates track the baseline plan closely, with no significant resource, scope, or dependency disruptions.
- If SV is positive: SV greater than zero means more work has been completed than planned. Values within +5% of PV are generally acceptable and reflect normal buffer use; larger gains often signal overestimated timelines or reduced scope. Causes include efficient resource allocation, early task completion, or overly conservative original estimates..
- If SV is negative: SV less than zero means less work has been completed than planned. Deviations beyond −10% of PV typically require a recovery plan, while smaller shortfalls fall within acceptable tolerance. Common causes include resource shortages, scope creep, dependency delays, or underestimated task durations at the planning stage.
How to improve schedule variance?
The five ways to improve schedule variance are: reassess planned value (PV) and earned value (EV) regularly, prioritize critical path activities, reallocate resources to delayed tasks, track schedule variance with SPI, and conduct regular schedule reviews.
These five practices work together to catch deviations early and correct course before delays compound.
- Reassess PV and EV regularly. Update planned and earned value figures at fixed intervals rather than only at milestones. Frequent reassessment catches drift early, before small deviations grow into significant schedule slippage that’s harder to recover from later in the project.
- Prioritize critical path activities. Direct resources and attention to tasks that directly affect the project end date. Delays on non-critical path activities have floated and don’t threaten the deadline, so critical path tasks deserve first claim on time and people.
| Insight: What is a critical path in project management? In project management, critical path is the set of activities that decide how long the project will take, and its start and end dates. For example, task 1 takes 20 days to complete, and task 2 takes 10 days. But task 2 takes place at the same time as task 1, which means task 1 is part of the critical path. Even if task 2 is delayed by 1 or 2 days, it will not affect how long the entire project takes (unless it is delayed by more than 10 days). |
- Reallocate resources to delayed tasks. Shift people, budget, or equipment from ahead-of-schedule tasks to behind-schedule ones. This rebalancing recovers lost time faster than adding entirely new resources and keeps the overall schedule aligned to plan.
- Track schedule variance with SPI. Schedule Performance Index (SPI) is calculated as EV ÷ PV and indicates schedule efficiency. While schedule variance measures the absolute difference between earned value and planned value, SPI expresses the same relationship as a ratio, making trends easier to compare over time. Recalculate both metrics at regular reporting intervals. For example, if SV improves from −$5,000 at the end of week 1 to −$2,000 at the end of week 2, the project is recovering. If it declines further to −$6,000, the project is falling farther behind schedule and may require corrective action.
- Conduct regular schedule audits. At each stage of the project, managers reevaluate all the data and statistics related to the project, and prepare a report. It helps teams review what went wrong and how they can correct it at the next stage.
What are the benefits of schedule variance?
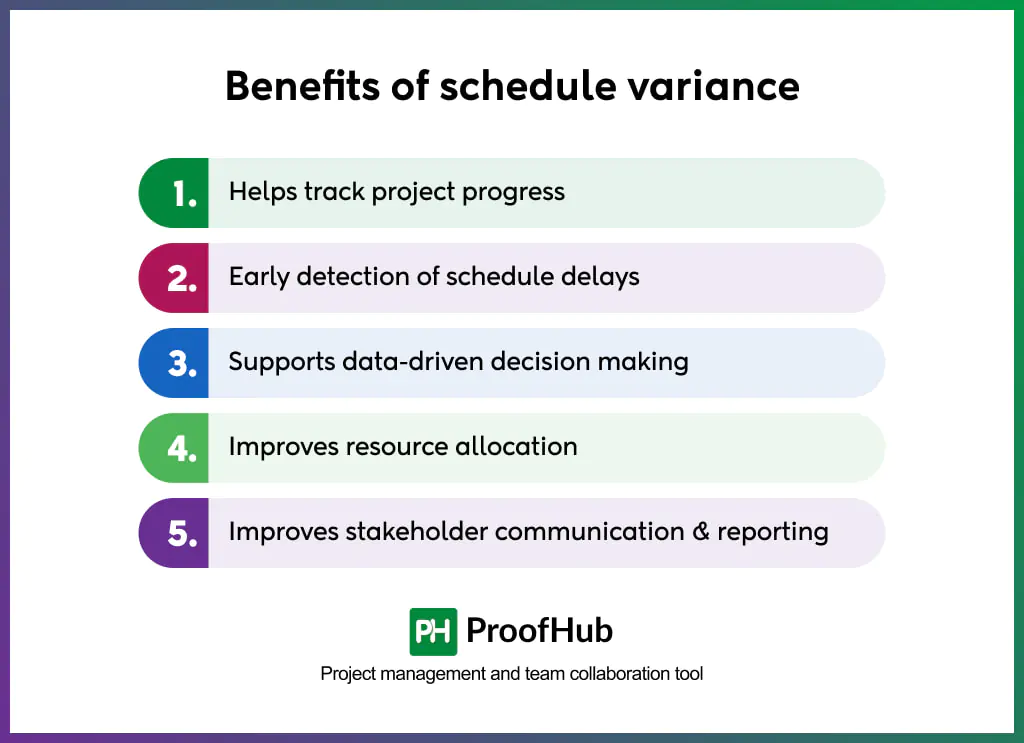
Schedule variance offers five key benefits: tracking project progress, enabling early detection of schedule delays, supporting data-driven decision making, improving resource allocation, and enhancing stakeholder communication and reporting.
Together, they give teams a clearer, more objective view of how a project is performing. This makes schedule variance one of the most widely used metrics in Schedule Performance Management.
Here’s a closer look at each benefit:
- Helps track project progress: Comparing planned work against completed work at any point in the project gives a clear, quantifiable measure of how the schedule is progressing against the baseline. This removes reliance on subjective status updates like “mostly on track,” replacing them with a number that’s easy to verify and compare across reporting periods.
- Early detection of schedule delays: Identifies deviations from the planned schedule as they occur, allowing project managers to investigate their causes and implement corrective actions before delays grow large enough to affect project milestones or completion dates.
- Supports data-driven decision making: Provides measurable schedule performance data that supports decisions on resource allocation, schedule adjustments, recovery planning, budget forecasting, and overall project performance evaluation instead of relying on assumptions or subjective progress assessments.
- Improves resource allocation: Highlights activities that are ahead of or behind schedule, helping project managers prioritize critical work and redistribute people, equipment, or budget to tasks that require additional support to maintain project timelines.
- Improves stakeholder communication & reporting: Schedule variance provides a standardized metric for reporting schedule performance to sponsors, clients, and other stakeholders. When used alongside Schedule Performance Index (SPI), it offers a clearer view of project progress and schedule efficiency.
What are the limitations of schedule variance?
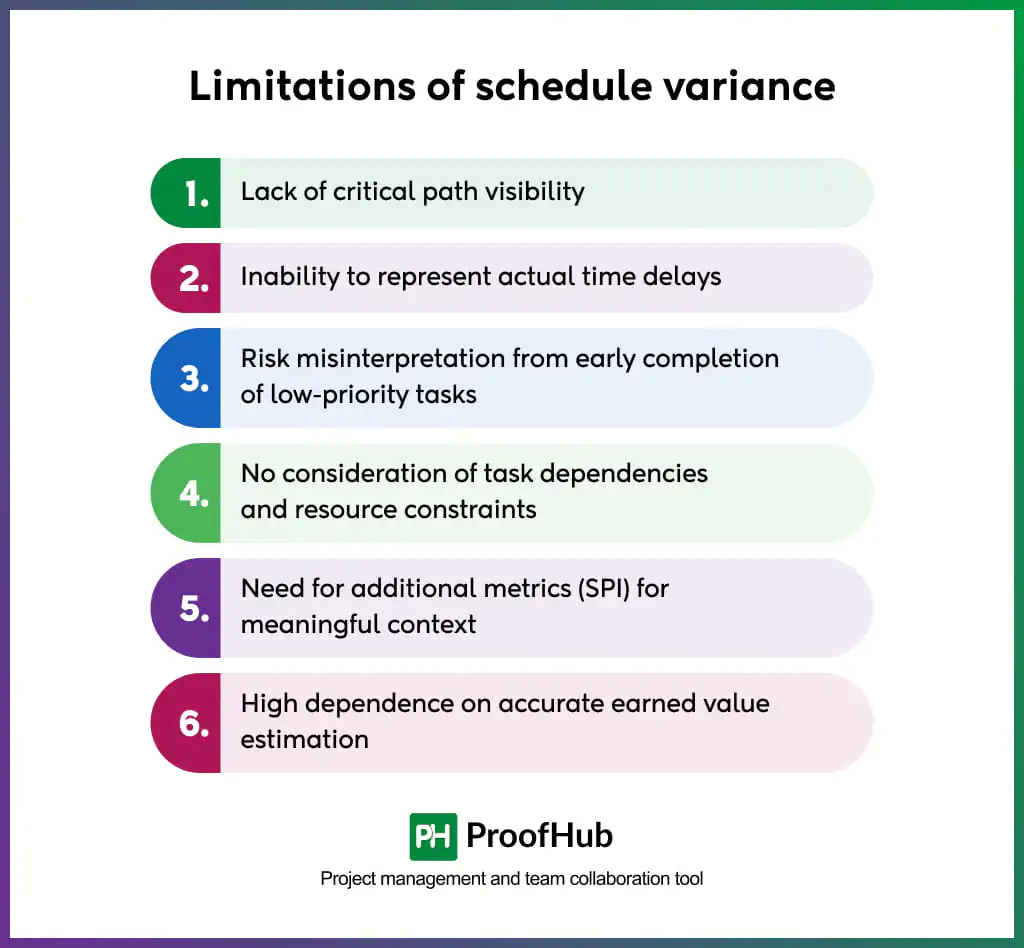
The limitations of schedule variance are: lack of critical path visibility, inability to represent actual time delays, risk of misinterpretation from early completion of low-priority tasks, no consideration of task dependencies and resource constraints, the need for additional metrics like SPI for meaningful context, and high dependence on accurate earned value estimation.
As a result, it works best when paired with other EVM metrics rather than used in isolation. Here’s a closer look at each limitation:
- Lack of critical path visibility: SV treats all tasks equally regardless of their impact on the project end date. A positive SV driven by non-critical tasks can mask a critical path delay that actually threatens the deadline.
- Inability to represent actual time delays: Measured strictly in monetary units, Schedule Variance cannot convey literal time delays. Furthermore, because the calculation automatically returns to zero at project completion, it fails to provide any historical data regarding how delayed the project actually was.
- Risk misinterpretation from early completion of low-priority tasks: Because individual tasks possess unique complexities and variances, overall metrics can mislead managers. Rapidly finishing low-priority, simple tasks creates a deceptively positive variance that overshadows negative progress on highly complex, critical project elements.
- No consideration of task dependencies and resource constraints: Projects rely heavily on resource availability and interdependencies where specific tasks must finish before others can begin. Schedule Variance calculates baseline deviations purely on value, completely ignoring these crucial workflow sequences and execution constraints.
- Need for additional metrics (SPI) for meaningful context: Schedule Variance alone cannot sufficiently evaluate an entire project’s health. It must be paired with complementary metrics from the Schedule Performance Domain, such as the Schedule Performance Index (SPI), to reveal a complete, accurate operational picture.
- High dependence on accurate earned value estimation: The precision of Schedule Variance relies entirely on how accurately Earned Value is estimated. If tracking teams calculate Earned Value incorrectly, it produces false variance metrics that ultimately mislead project managers, stakeholders, and financial analysts.
What is the relationship between schedule variance and earned value management?
Schedule variance (SV) is a metric that measures how far a project has deviated from its schedule baseline, calculated as the difference between earned value (EV) and planned value (PV).
Earned value management (EVM) is a broader project management methodology that integrates scope, schedule, and cost data to objectively measure project performance and progress.
What is the difference between schedule, cost and time variance?
Schedule variance (SV) is the difference between earned value (EV) and planned value (PV), used to show whether a project is ahead of or behind its schedule baseline.
Cost variance (CV) is the difference between earned value (EV) and actual cost (AC), used to show whether a project is under or over its planned budget.
Time variance simply measures the difference between the planned and actual duration or completion date of a task, without factoring in the value of work performed.
What is the difference between schedule variance and schedule performance index?
Schedule variance (SV) is the absolute difference between earned value (EV) and planned value (PV), expressed in monetary or time units, showing how far ahead or behind schedule a project is.
Schedule performance index (SPI) is the ratio of earned value (EV) to planned value (PV), expressed as a decimal, showing schedule efficiency relative to the plan.
What is the difference between schedule variance and schedule slippage?
Schedule variance (SV) is a calculated metric, derived from earned value (EV) and planned value (PV), that quantifies how far a project has deviated from its schedule baseline.
Schedule slippage is a general term describing any delay in the project timeline, whether or not it has been formally measured using earned value data.
How often should I calculate schedule variance for my projects?
Most teams calculate schedule variance weekly or biweekly to catch deviations early. Larger or longer projects may track it monthly, but shorter or higher risk projects benefit from more frequent checks.
Conclusion
Schedule variance is a useful metric that helps managers and stakeholders evaluate the efficacy of an ongoing project. It is used as a current metric that updates the team at each point of the project, and also as part of a project report that evaluates how the project progressed over its entire duration. It helps in correcting any divergence between what the project is required to deliver and what the project is actually delivering. It is also significant for budgeting and optimal resource allocation.
For managers wanting to minimize lag and budget overruns, schedule variance is an invaluable resource.