Collaboration is measured by evaluating how effectively individuals, teams, or departments work together to achieve shared goals. It involves identifying the Key Performance Indicators (KPIs) that show how people connect, share knowledge, and align around common goals, and then analyzing those signals to understand where collaboration can be improved. The most widely used KPIs for measuring collaboration fall under two categories:
- Quantitative indicators: Metrics that can be measured in numbers, such as project completion rates, task turnaround times, meeting frequency, or decision-making speed.
- Qualitative indicators: Insights based on perception and experience, such as employee surveys, peer feedback, idea-sharing, and communication quality.
Measuring collaboration helps organizations identify strengths, weaknesses, and opportunities to improve team dynamics and productivity. Additionally, it uncovers the hidden factors behind project delays, innovation bottlenecks, and cultural silos, and can help identify issues that harm productivity.
In the following sections, this article will explore why measuring collaboration is important, what KPIs are most effective, how to deal with common challenges, and what tools organizations can use to measure, track, and optimize collaboration with precision.
Why is measuring collaboration important?
Measuring collaboration allows organizations to turn team interactions into clear, actionable data that drives performance, innovation, and engagement. It helps organizations shift their focus from merely evaluating outcomes to understanding and optimizing the processes that create them. Without measurement, collaboration remains an assumption, often hiding misalignment, duplicated work, and wasted resources.
When organizations track how knowledge flows across teams and functions, they can reduce duplication, shorten decision cycles, and accelerate product delivery.
Without measurement, the real cost of poor collaboration stays invisible. According to the 2024 Forrester Consulting study commissioned by Vonage, 38% of businesses reported that poor internal collaboration directly costs them business, making ineffective teamwork not just a productivity issue, but a revenue-draining problem. Unnecessary meetings, overlapping responsibilities, and stalled approvals may not appear in standard performance metrics, but they drain resources and delay projects.
8 KPIs for measuring collaboration success
Collaboration success can be tracked through 8 Key Performance Indicators, categorized into four quantitative and four qualitative indicators.
Unlike traditional KPIs that focus purely on outcomes such as deadlines met or revenue generated, collaboration KPIs capture the quality of the interactions, decisions, and handoffs that drive those outcomes. They are more complex to track because collaboration rarely lives in one tool or one workflow. It happens in conversations, across dependencies, and in shared ownership of goals.
Together, they help leaders identify whether challenges stem from execution issues or alignment gaps, ensuring that work gets done not just efficiently, but collaboratively and sustainably.
Quantitative KPIs
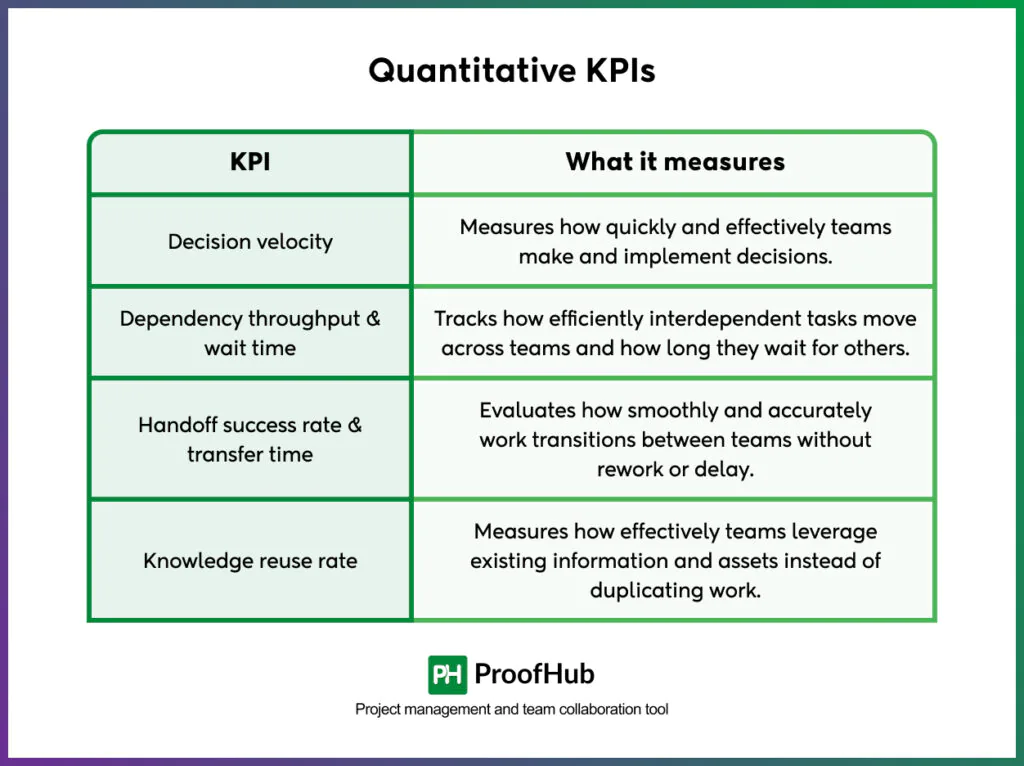
Quantitative KPIs are numerical or measurable metrics used to evaluate how effectively teams collaborate. These metrics focus on speed, output, and consistency, helping leaders understand whether collaborative efforts are translating into tangible results. They reveal the what of collaboration — how fast, how often, and how effectively teams are moving work forward.
1. Decision velocity
Decision velocity measures how quickly and effectively teams reach alignment on choices that drive work forward. Tracking the average time from when an issue or task is raised to when a final decision is made helps identify bottlenecks in communication or authority. A higher decision velocity reflects clear ownership, trust, and streamlined collaboration — all essential for agile and productive teamwork.
What this KPI tells you:
- Indicates how efficiently teams make and implement decisions.
- Reflects the level of alignment, communication, and trust within teams.
- A high decision velocity shows empowered teams with clear roles and minimal approval delays.
- Helps leaders identify whether collaboration is enabling quick, informed decisions or causing bottlenecks.
2. Dependency throughput and wait time
Dependency throughput and wait time measure how efficiently handoffs are managed. Dependency throughput tracks how many dependent tasks move forward within a given period, while wait time measures how long tasks are delayed while waiting on others. Together, they show how effectively teams coordinate across functions and how quickly work flows from one stage or team to another.
What this KPI tells you:
- Indicates how well teams manage interdependencies in collaborative workflows.
- A high throughput with low wait time reflects smooth coordination, proactive communication, and balanced workloads.
- A low throughput or long wait time suggests bottlenecks, unclear ownership, or poor prioritization between teams.
- Helps identify where collaboration slows down—whether due to resource constraints, approval delays, or unclear task ownership.
- Provides a clear picture of how cross-functional alignment affects overall project speed and efficiency.
3. Handoff success rate and transfer time
Handoff success rate and transfer time measure how effectively and efficiently transitions work from one team or function to another. This KPI focuses on three measurable components—the first-pass acceptance rate (percentage of deliverables accepted without rework), the handoff defect rate (percentage requiring corrections or added context), and the time-to-ready (average time for the receiving team to confirm readiness and continue work).
What this KPI tells you:
- How reliably work is accepted and understood on the first attempt.
- Where miscommunication or context gaps are causing avoidable rework.
- How long teams spend waiting for validation after each handoff.
- Whether improvements in process clarity are translating into faster collaboration.
4. Knowledge reuse rate and duplication avoided
Knowledge reuse rate and duplication avoided measure how effectively teams access, share, and repurpose existing information or assets to complete their work. This KPI captures three measurable aspects:
- Reuse rate: Percentage of new deliverables that incorporate existing assets or documentation
- Duplicate tasks avoided: Number of duplicate efforts identified and merged before completion,
- Time-to-find: Average time it takes to locate the correct information or expert.
What this KPI tells you:
- How effectively teams build on each other’s work instead of recreating it.
- Whether documentation and repositories genuinely support collaboration.
- How easily can team members find the information they need to contribute?
- Where silos or knowledge gaps are slowing down collective progress.
Qualitative KPIs

Qualitative KPIs are indicators that focus on the quality, effectiveness, and experience of collaboration rather than strictly measurable outputs. They capture aspects such as team communication, trust, alignment, knowledge sharing, and engagement—factors that directly influence how smoothly and effectively teams work together. They are often gathered through surveys, interviews, and structured feedback sessions.
Unlike quantitative KPIs, which measure speed, volume, or completion, qualitative KPIs help leaders understand why collaboration is succeeding or struggling and provide insights into cultural, behavioral, and relational dynamics that drive performance.
5. Cross-functional ownership and contribution
Cross-functional ownership and contribution reflect how clearly responsibilities are understood and how genuinely teams share accountability for results. This KPI examines how teams perceive clarity around who leads what, how openly they contribute across functions, and whether decision-making feels inclusive rather than top-down.
What this KPI tells you:
- How confident people feel about who makes decisions and outcomes.
- Whether collaboration is inclusive or limited to a few dominant voices.
- How fairly contributions are recognized across departments.
- Whether shared accountability motivates teams or creates confusion.
6. Innovation output
Innovation output reflects how effectively cross-functional collaboration leads to new ideas, solutions, or improvements. It assesses the quality, originality, and impact of innovations generated through teamwork, rather than simply counting the number of ideas. It captures whether collaboration encourages creativity, experimentation, and problem-solving across functions.
Teams that collaborate well are more likely to combine diverse perspectives, challenge assumptions, and generate breakthrough solutions. Measuring innovation output helps leaders understand whether collaboration is not just functional, but transformative—driving continuous improvement and creating value for the organization.
What this KPI tells you:
- How effectively collaboration produces new ideas or solutions.
- Whether diverse perspectives are being leveraged in problem-solving.
- If collaboration fosters creativity, experimentation, and risk-taking.
- How innovation contributes to business growth, efficiency, or customer value.
7. Continuous improvement follow-through
Continuous improvement follows-through measures how effectively teams implement learned lessons, process enhancements, and agreed-upon improvements from collaborative initiatives. It focuses on whether ideas for improvement are consistently acted upon, rather than just discussed or documented.
Teams that follow through on changes demonstrate accountability, adaptability, and a commitment to learning from past experiences. Monitoring it helps leaders see whether collaborative efforts lead to real progress or stall due to a lack of ownership or follow-up.
What this KPI tells you:
- Whether teams act on feedback, lessons learned, and process improvements.
- How consistently improvements are applied across functions.
- Whether collaborative initiatives lead to sustainable changes.
- If teams are accountable and proactive in enhancing workflows and outcomes.
8. Stakeholder satisfaction
Stakeholder satisfaction captures how well collaborative projects meet the expectations and needs of both internal and external stakeholders — including team members, managers, clients, and partners. It reflects the perceived quality of communication, transparency, responsiveness, and overall effectiveness of cross-functional collaboration.
Satisfied stakeholders are a strong indicator of healthy collaboration. When stakeholders feel informed, heard, and confident in the team’s ability to deliver, it signals alignment, trust, and shared ownership.
What this KPI tells you:
- How well project outcomes align with stakeholder expectations.
- Whether communication and transparency are maintained throughout the project.
- How effectively teams respond to stakeholder feedback and changing needs.
- Whether collaboration fosters confidence and trust among stakeholders.
What are the methods for measuring collaboration?
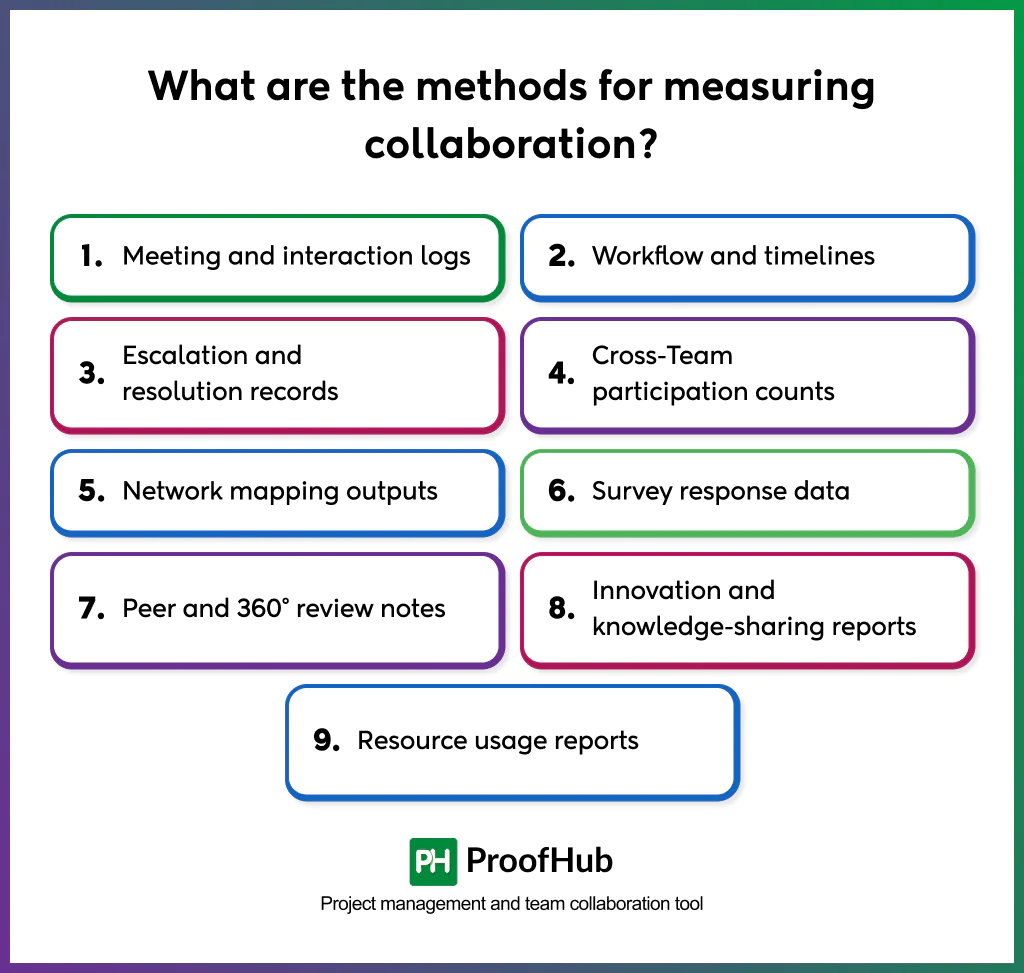
Measuring collaboration requires both structured data collection and contextual insights. Measure collaboration through surveys, peer evaluations, project outputs, team structure analysis, team behavioral assessments, and the use of collaboration tools.
Combine quantitative tracking (like project outcomes or workflow timelines) with qualitative inputs (such as surveys or peer reviews). By applying multiple methods in parallel, organizations can reduce blind spots, validate results, and turn collaboration from an assumption into a measurable, actionable driver of performance.
- Surveys and questionnaires: Conducting surveys or questionnaires can provide valuable insights into employees’ perceptions of collaboration. Ask questions related to teamwork, communication, information sharing, and the effectiveness of collaborative processes. The responses can provide quantitative or qualitative data to gauge collaboration within teams or across the organization.
- Peer evaluations: Encourage peers to evaluate each other’s collaborative behaviors and contributions. This can be done through structured assessments or feedback forms that assess qualities like active listening, cooperation, knowledge sharing, and supportiveness. Peer evaluations provide a holistic perspective on collaboration and can identify high-performing collaborators.
- Project outcomes and performance metrics: Collaboration often aims to achieve shared goals. Therefore, assessing project outcomes and performance metrics can indirectly measure the effectiveness of collaboration. Look at metrics such as project completion rates, deliverable quality, customer satisfaction, and financial performance. If collaborative efforts positively impact these metrics, it suggests successful collaboration.
- Network analysis: Identifies individuals who act as central connectors or bridges between teams or departments by mapping relationships, communication channels, and information flows. The density and strength of these connections can indicate the level of collaboration.
- Observations and behavioral assessments: Direct observation and behavioral assessments by managers or designated observers can capture collaboration in action. Assess factors like participation, contribution, active listening, idea generation, and conflict resolution during team meetings or collaborative projects. These assessments should be conducted with clear evaluation criteria and guidelines.
- Technology-based collaboration Tools: Collaboration platforms and tools, such as project management software, document-sharing platforms, or communication tools, often provide data on user engagement, contribution frequency, or interaction patterns.
What are the types of data collaboration KPIs measure?
Collaboration KPIs rely on specific types of data that capture how teams interact, share information, and deliver outcomes. Importantly, these data streams are not about measuring individual performance. These data types can be grouped into four broad categories: interaction and behavior, shared output and process, structural and network, and perceptual and qualitative.
1. Meeting and interaction logs
Meeting and interaction logs are the attendance, frequency, and duration records of collaborative sessions. They show how often teams come together, how much time is spent in discussions, and whether decision-making is concentrated in large meetings or handled in smaller, targeted groups.
2. Workflow and timelines
Workflow and task timelines are the timestamps that record how tasks move from creation to completion. They include handoff times between functions, approval durations, and the total cycle time for multi-team work.
3. Escalation and resolution records
Escalation and resolution records capture how often teams are unable to resolve issues at their level and must involve higher management.
4. Cross-Team participation counts
Cross-team participation counts record how many unique contributors from different departments are actively involved in shared initiatives. This data highlights whether collaboration spans across functions or remains limited to silos.
5. Survey response data
Survey response data is the scored feedback employees provide on structured items about collaboration. These responses indicate whether people feel goals are shared, can get timely input from other teams, and understand responsibilities clearly. Combined with interaction logs and project timelines, survey data provides the human perspective and supports KPIs that track engagement, trust, and alignment.
6. Innovation and knowledge-sharing reports
Innovation and knowledge-sharing reports track new ideas, solutions adopted, and resources added to shared repositories. This data shows how collaboration generates fresh contributions rather than routine work and supports KPIs on innovation output and knowledge exchange.
7. Resource usage reports
Resource usage reports measure how teams engage with shared tools, training, or assets, such as project platform adoption, hours in collaborative training, or use of shared budgets, helping link collaboration investments to measurable engagement.
What are the challenges in measuring collaboration?

Measuring collaboration is essential, but it is far from straightforward. The effort to capture how people work together creates its own set of difficulties. These challenges explain why many organizations struggle to build systems that are both accurate and trusted.
- Defining what to measure: Collaboration is multidimensional and context-dependent, making it challenging to create universal metrics that distinguish productive teamwork from mere interaction.
- Balancing quantitative and qualitative data: Numbers show patterns, but don’t tell the whole story. People’s perceptions give context but are subjective. Using only one type can miss important issues, so the challenge is to combine both in a way that’s simple to track but still meaningful.
- Interpreting and acting on data. Collecting metrics is just the first step. The real challenge is using them to make real improvements. Without analyzing the data and adjusting processes or behaviors, reports only show problems but don’t drive change.
What are the best tools to measure collaboration performance?
Measuring collaboration requires more than knowing which KPIs to track. Organizations also need the right tools to capture evidence of how teams work together. While many workplace platforms were not initially built for measurement, they generate data that can be analyzed to evaluate collaboration quality. Below are the most important tools that provide the raw input for collaboration KPIs.
- Activity Logs
Activity logs capture the granular trail of collaborative actions across tools. Aggregated at the team or project level, activity logs power KPIs for responsiveness, cycle time, participation intensity, and rework. Used thoughtfully (team-level, not individual surveillance), activity logs provide the most complete view of collaboration in motion.
- Gantt charts
Gantt charts show task timelines and dependencies across teams. By tracking where deadlines slip—especially at handoff points—leaders can identify weak spots in cross-functional collaboration.
- Discussion boards
Discussion boards capture knowledge exchange in forums and threaded conversations. The number of active contributors, cross-department responses, and the resolution of open questions reveal how effectively knowledge flows.
- Calendars and meeting tool
Calendars and meeting platforms track the scheduling, frequency, and participation of collaborative sessions. This data highlights how much time teams spend in alignment activities versus execution. Patterns such as recurring cancellations or overloaded calendars provide early warnings of inefficiency.
- Project and issue trackers
Project and issue trackers record how tasks move through workflows. From ticket creation to resolution, these platforms capture the speed and effectiveness of cross-team collaboration.
- Survey platforms
Survey platforms gather employee perceptions of collaboration quality. They provide quantitative ratings and qualitative comments on trust, alignment, and psychological safety.
- Organizational network analysis (ONA) tools
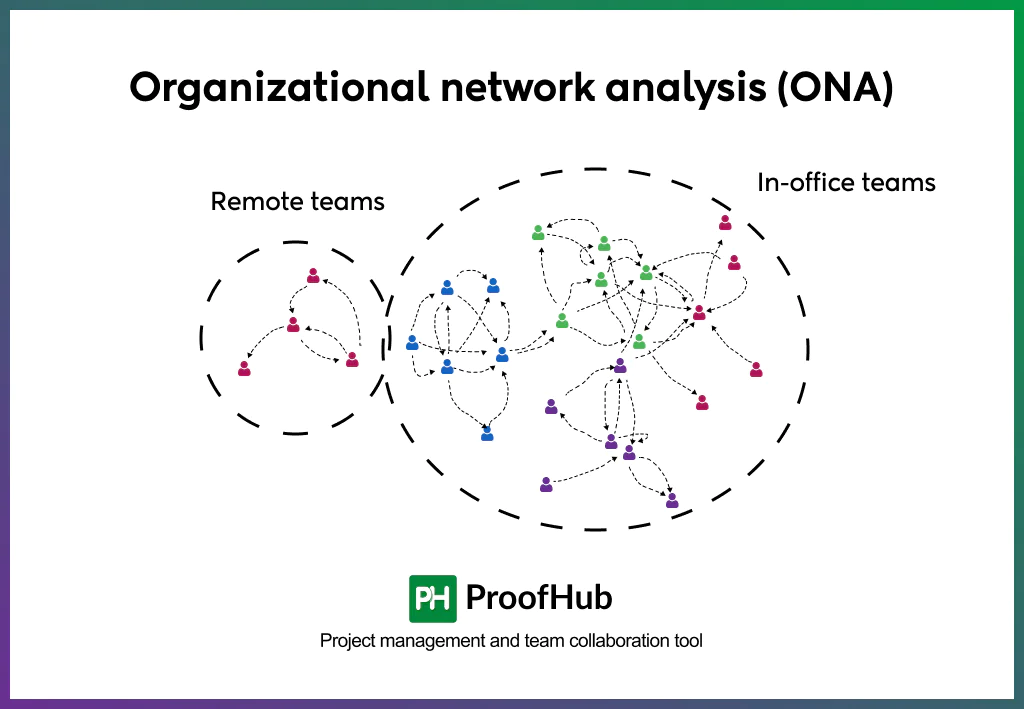
Organizational network analysis tools map the actual relationships between teams. They visualize who communicates with whom, how often, and where bottlenecks occur.
How to benchmark collaborative performance?
Benchmarking collaborative performance means comparing how well your teams work together against standards, past performance, or industry peers. Here’s how to do it:
1. Define Collaboration Metrics
Decide what aspects of collaboration you want to measure, such as:
- Communication frequency and responsiveness
- Knowledge sharing and reuse
- Meeting efficiency
- Cross-team project success
2. Collect Relevant Data
Use both quantitative and qualitative sources:
- Meeting logs, shared documents, project tracking tools (quantitative)
- Employee surveys, feedback, or peer reviews (qualitative)
3. Set Benchmarks
- Internal benchmarks: Compare teams against each other or against past performance.
- External benchmarks: Compare with industry standards, best practices, or competitor data.
4. Analyze and Interpret
Look for patterns, strengths, and gaps in collaboration. Identify what’s working and what needs improvement.
5. Take Action and Reassess
Use the insights to improve processes, tools, or team behaviors. Reassess periodically to track progress.
How often should collaboration be measured?
Collaboration should be measured regularly but balanced to avoid overload. For most organizations, a combination of continuous tracking (e.g., project tools, meeting logs) and periodic reviews (e.g., quarterly surveys or performance reviews) works best. Frequent measurement helps identify issues early, while periodic assessments capture deeper insights and trends over time.
Can employee engagement indicate collaboration success?
Yes, employee engagement can be a strong indicator of collaboration success. Engaged employees are more likely to communicate openly, share knowledge, and work effectively in teams—key aspects of collaboration. However, engagement alone doesn’t guarantee effective collaboration, as motivated individuals may still work in silos. To get a complete picture, organizations should combine engagement data with direct collaboration metrics such as interaction frequency, shared outputs, and network connectivity.”